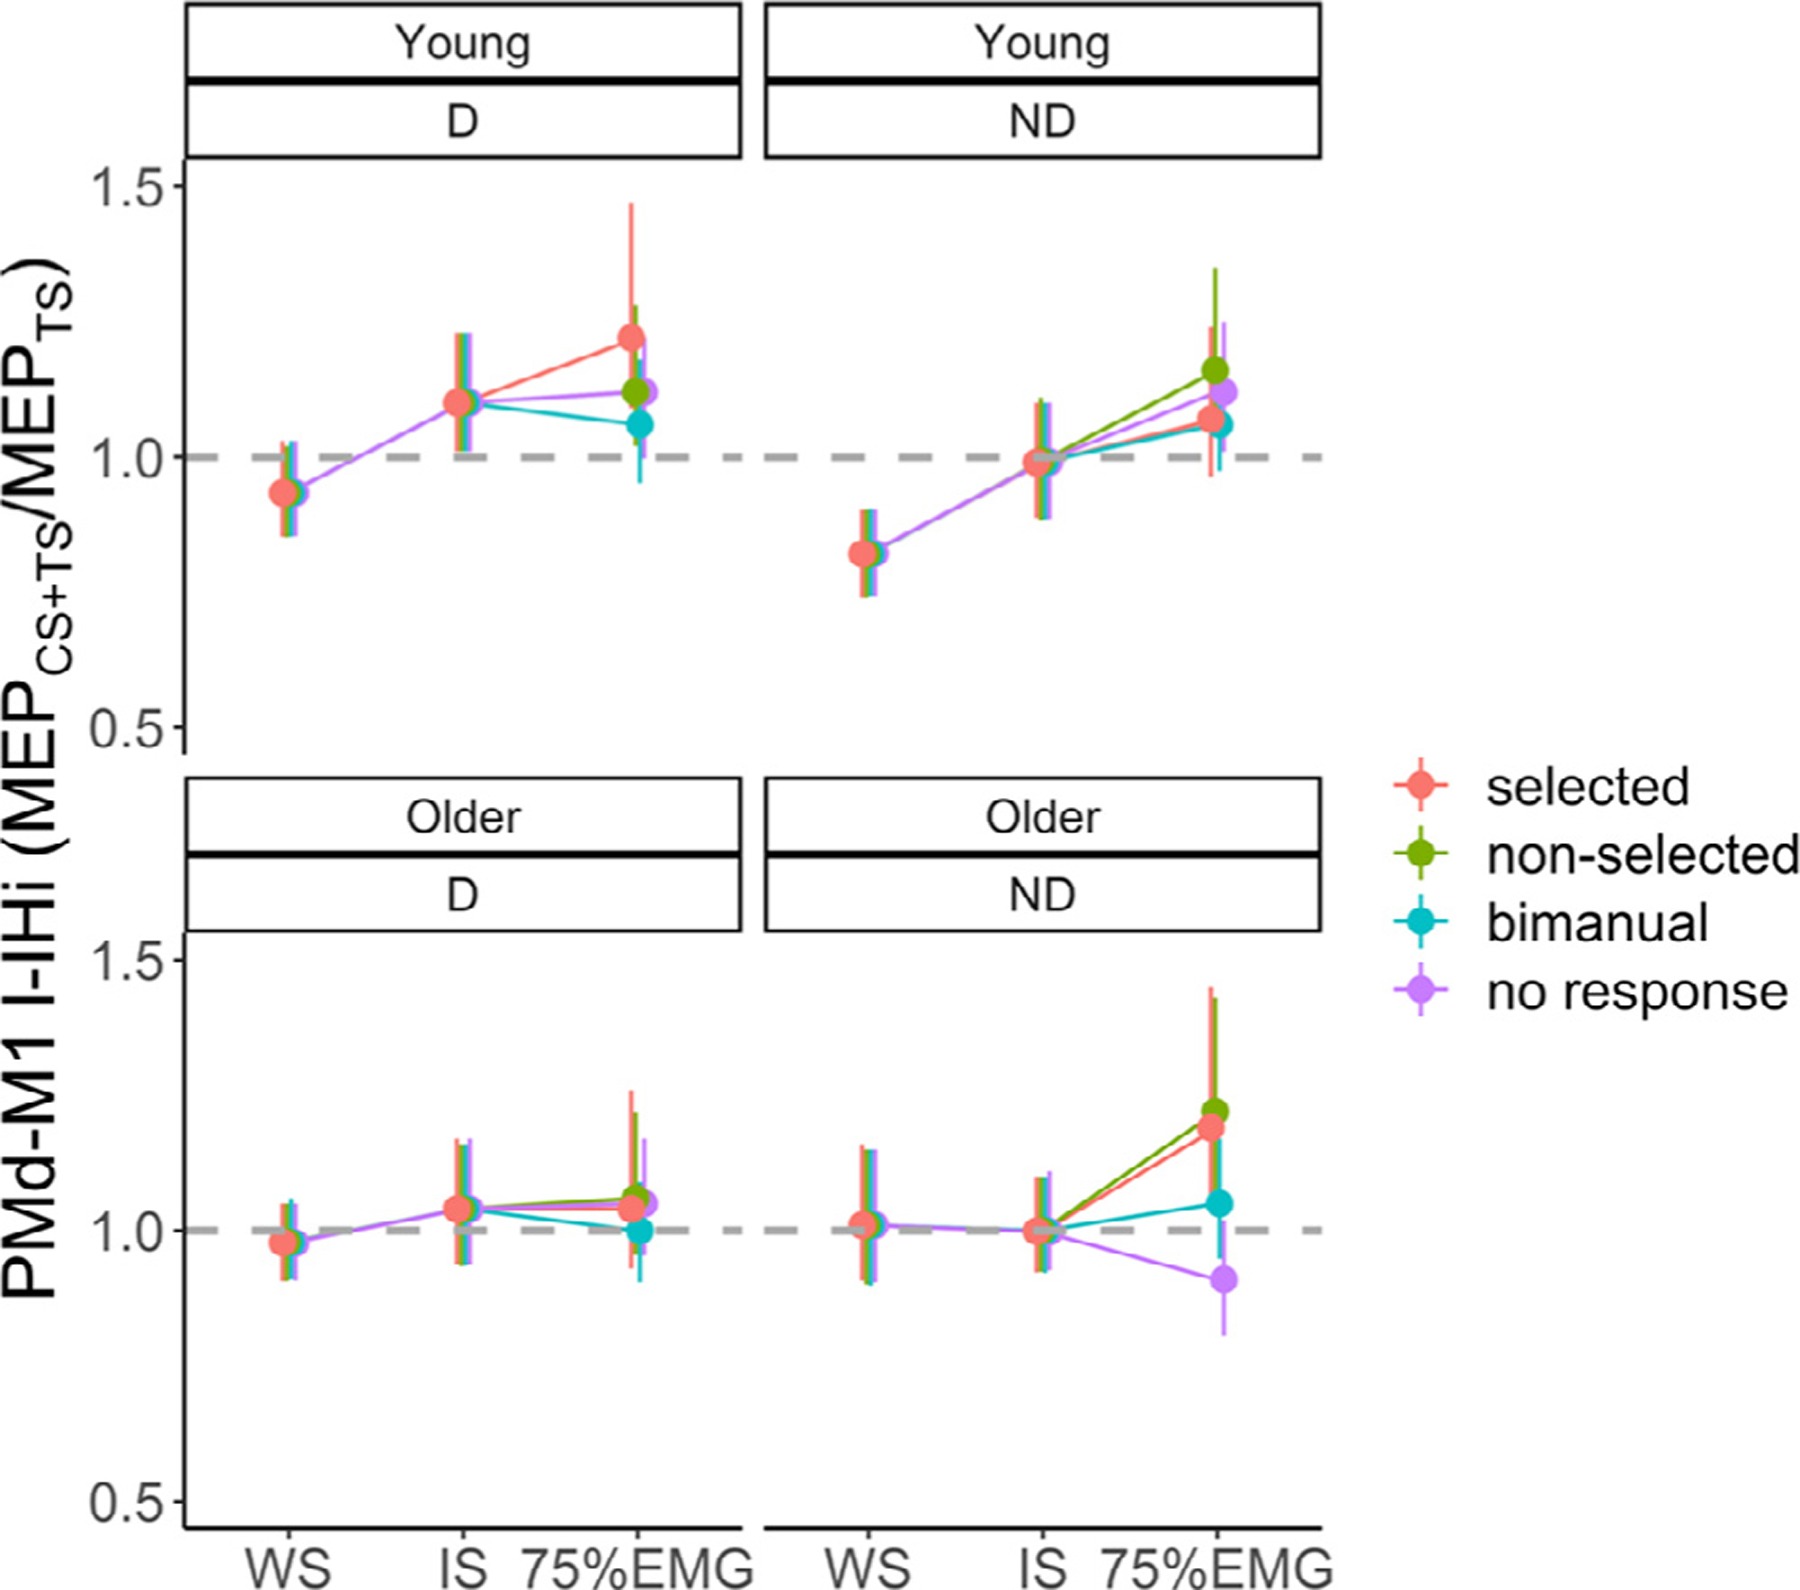
Fig. A3.

Long latency interhemispheric PMd-M1 interactions (PMd-M1 l-IHi) at each time point during a trial, for each age group (Young vs. Older) and target hemisphere (D vs. ND). Line plots in different colours represent the different response conditions (selected vs. non-selected vs. bimanual vs. no response). Values below the dashed line indicate an inhibitory PMd-M1 l-IHi, whereas values above the dashed line indicate a facilitatory PMd-M1 l-IHi. Error bars indicate 95%CIs. Abbreviations: D, dominant; ND, non-dominant; WS, warning signal; IS, imperative signal; 75%EMG, 75% of the time between IS onset and EMG onset; PMd, dorsal premotor cortex; M1, primary motor cortex; CS, conditioning stimulus; TS, test stimulus.
