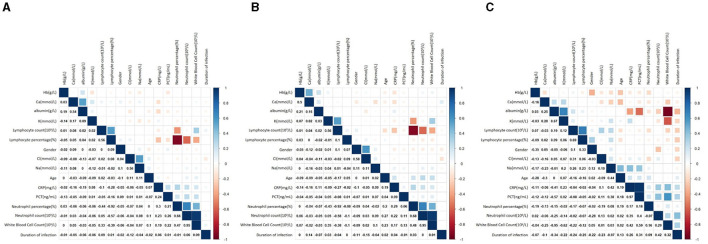
Figure 2.
Heat map of correlation analysis. (A) Associations between nutritional status, infection levels and pneumonia in all infected patients. (B) Associations between nutritional status, infection levels and pneumonia in HAP. (C) Associations between nutritional status, infection levels and pneumonia in CAP.

