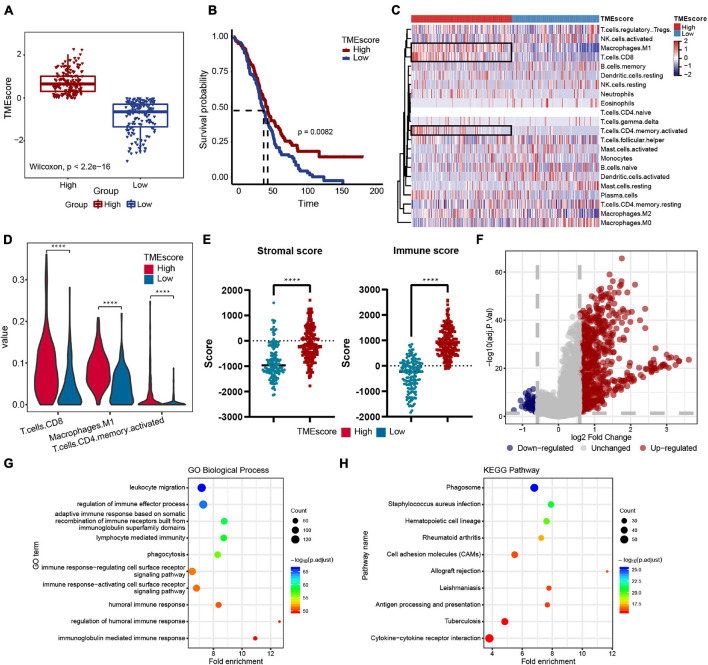
FIGURE 2.
Immune features of the ovarian cancer (OC) microenvironment and identification of molecular characteristic. (A) TMEscore of samples in the TCGA-OV dataset (high group: 181 samples, low group: 158 samples). Wilcoxon’s test, p < 2.2e-16. (B) Overall survival (OS) Kaplan–Meier curves of TMEscore, log-rank test, p = 0.0082. (C) Heatmap of the 22 immune cell proportions in two TME group. (D) Violin plot of abundance of CD8+ T cells, M1 macrophages, and activated CD4+ memory T cells in the two groups. (E) Correlation between TMEscore and immune-stromal score. (F) Volcano plot of all differentially expressed genes (DEGs); the red dots represent upregulated genes, the blue dots represent downregulated genes, and the gray dots represent unchanged genes. (G,H) Genetic ontology (GO) biological process and Kyoto Encyclopedia of Genes and Genomes (KEGG) pathway enrichment analysis of DEGs; the fold enrichment represents the ratio of the gene ratio to background ratio. ****p < 0.0001.

