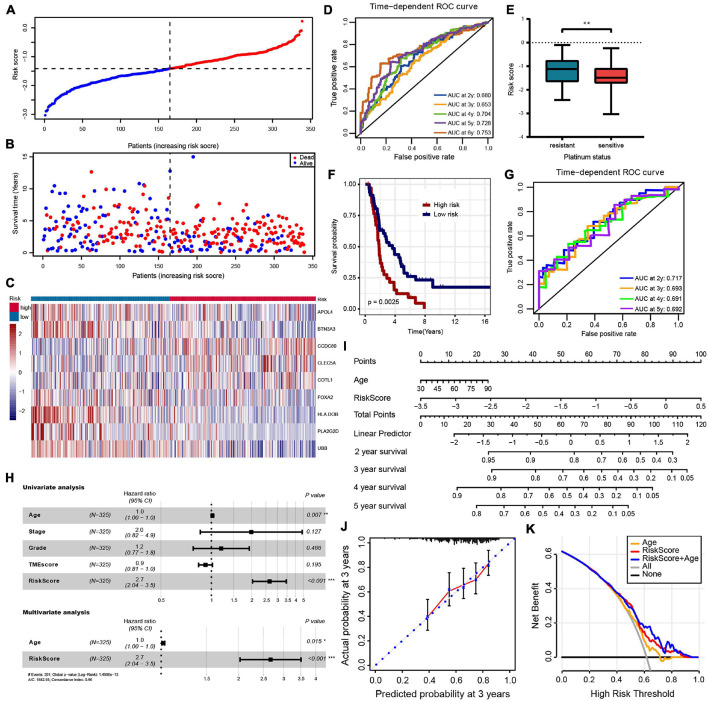
FIGURE 4.
(A–C) The risk score distribution, patients’ survival status and gene expression profiles are displayed; the black-dotted line divided patients into high- and low-risk groups. (D) Time-dependent receiver operating characteristic (ROC) curve analysis of survival prediction by the prognostic model. (E) The risk score of platinum-resistant patients with OC is significantly higher than that of platinum-sensitive patients. (F,G) OS K–M curves and time-dependent ROC curves for the prognostic model in the ICGC OV-AU cohort. (H) Univariate and multivariate associations of the prognostic model and clinical characteristics with OS. (I) The nomogram is applied by adding up the points identified on the point scale for each variable. The total points projected on the bottom scales indicate the probability of 2-, 3- 4-, and 5-year OS. (J) The calibration curve for predicting 3-year OS for patients with OC; the Y-axis represents actual survival, as measured by K–M analysis, and the X-axis represents the prognostic model-predicted survival. (K) The net benefit (Y-axis) of age, risk model, and the nomogram; the black solid line represents the assumption that all patients survived, the gray solid line represents the assumption that no patients survived, and the orange, red, or blue solid lines represent the age, risk model, and nomograms. ***p < 0.001; **p < 0.01; *p < 0.05.

