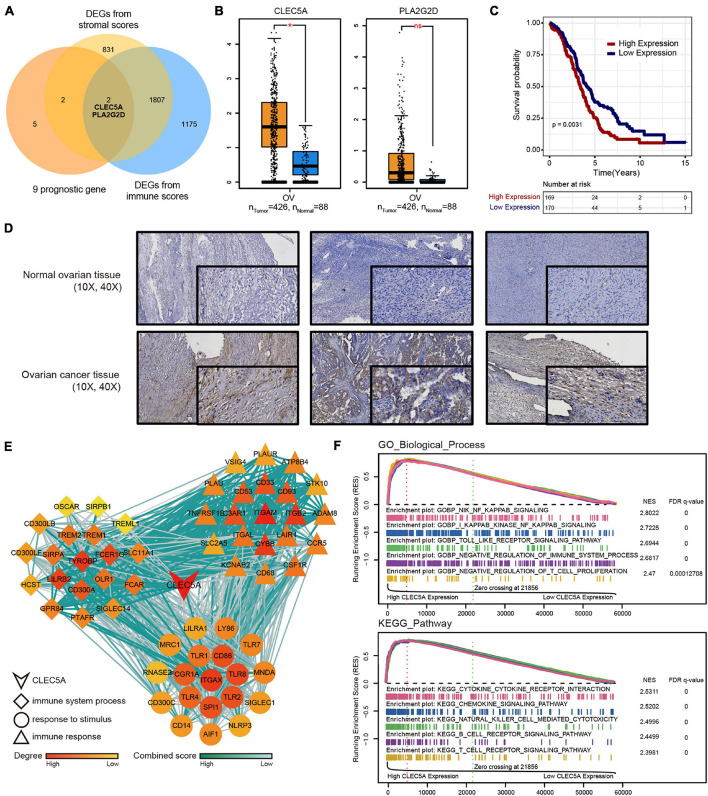
FIGURE 5.
(A) Venn diagram of DEGs from TMEscore and immune-stromal score. (B) Expression difference of CLEC5A and PLA2G2D in normal ovarian tissue and OC. (C) OS Kaplan–Meier curves of CLEC5A. (D) Expression of CLEC5A in normal ovarian tissue and OC (immunohistochemical staining). (E) The functions of three groups of CLEC5A-related genes. (F) Single-gene GSEA analysis of CLEC5A (GO-BP and KEGG pathway).*, p < 0.05; ns, no significance.

