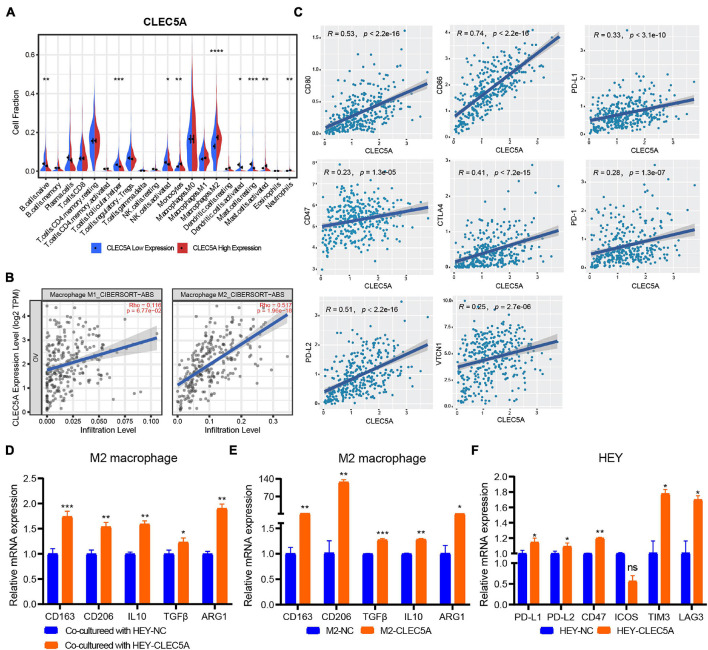
FIGURE 6.
(A) Correlation analysis of CLEC5A expression and immune cell components in the TME of OC (TCGA-OV dataset). (B) Correlation analysis between the expression of CLEC5A and the infiltration of M1 and M2 macrophages in TME of OC. (C) Correlation analysis of CLEC5A expression and immune checkpoint gene. (D) When the M2 macrophages were co-culture with OC cell line HEY overexpressing CLEC5A, the M2 polarization level of macrophages increased. (E) After overexpression of CLEC5A in M2 macrophages, the M2 polarization level increased. (F) The expression of immune checkpoint genes PD-L1, PD-L1, CD47, TIM3, and LAG3 increased in OC cell line HEY overexpressing CLEC5A. ****p < 0.0001; ***p < 0.001; **p < 0.01; *p < 0.05; ns, no significance.

