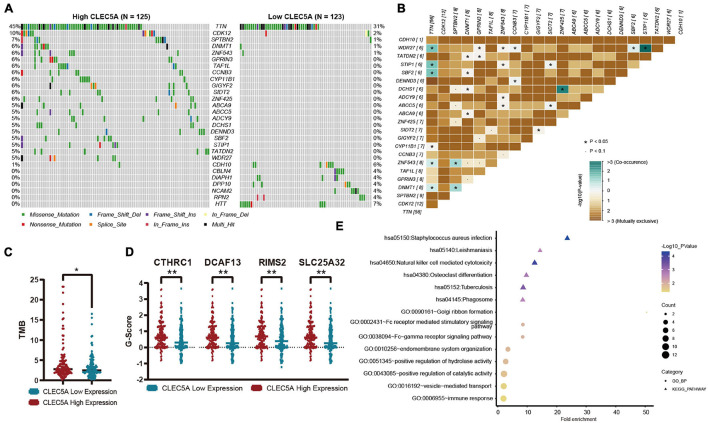
FIGURE 7.
(A) Mutation genes with significant difference between high- and low-expression CLEC5A groups. (B) Analysis of co-mutation and exclusive mutations in the CLEC5A overexpression group. (C) The difference of tumor mutational burden (TMB) levels in high- and low-expression CLEC5A groups. (D) Genes with significantly increased copy number variation in CLEC5A overexpression group. (E) Functional analysis of genes with decreased copy number variation in CLEC5A overexpression group. **p < 0.01; *p < 0.05.

