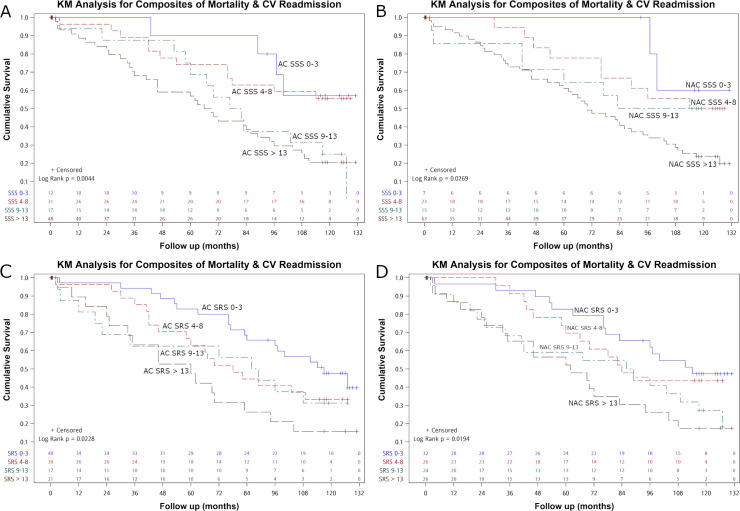
Fig 2.
Kaplan-Meier (KM) analysis regarding the composite of all-cause mortality and cardiovascular-related re-admission with SSS 0–3, 4–8, 9–13 and >13 in AC (A), NAC (B), SRS 0–3, 4–8, 9–13 and >13 in AC (C) and NAC (D) images. Significant differences between survivor functions were noted between the SSS four groups (p = 0.004 for AC, 0.027 for NAC) and SRS four groups (p = 0.023 for AC, 0.019 for NAC).

