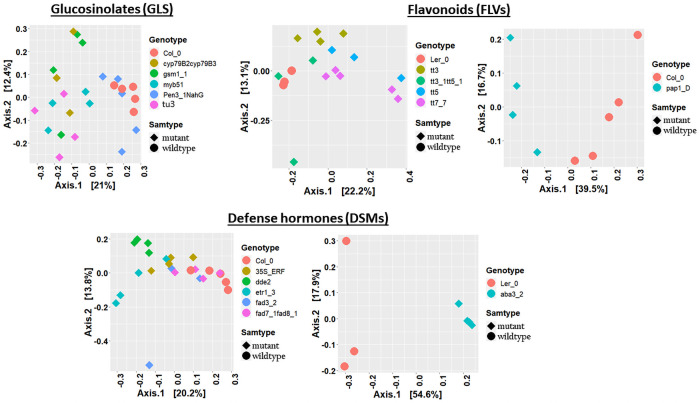
Fig 4. Principal coordinate analysis (PCoA) plots of fungal communities in Arabidopsis secondary metabolite and signalling mutants, and their parental lines.
PCoA of fungal communities in GLS (A), FLV (B) and DSM (C) genotypes. Individual genotypes and sample groups are shown in different colours and shapes.

