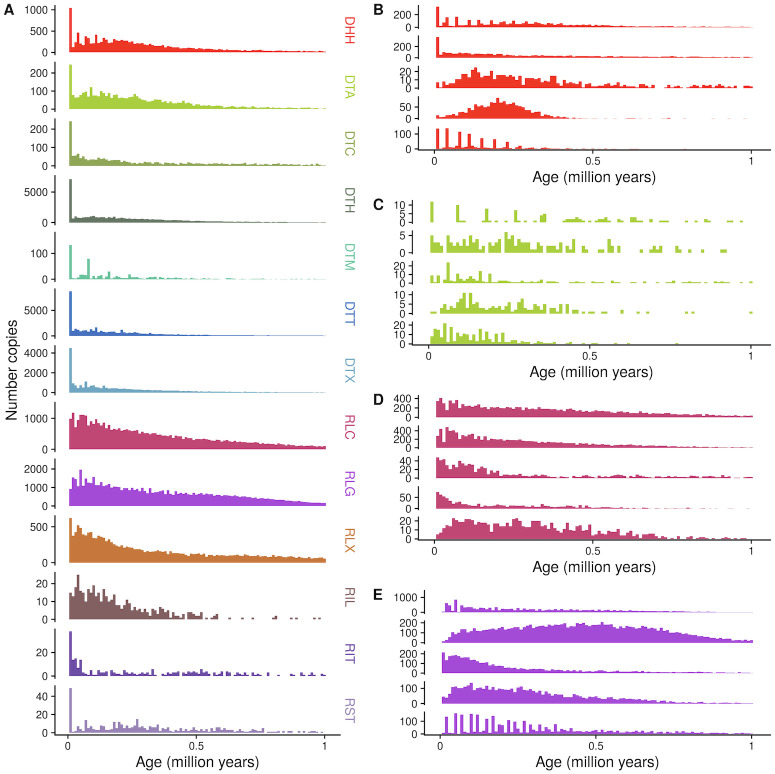
Fig 4. Age distribution of (A) superfamilies and (B-E) five largest families of (B) DHH, (C) DTA, (D) RLC, and (E) RLG.
Family names are listed in S1 Table. Counts of number of insertions in 10,000 year bins are shown. As they are rare, TE copies older than 1.1 million years are not shown. Ages are calculated with terminal branch lengths for all TEs except LTR retrotransposons, which are calculated with LTR-LTR divergence. See S5 Fig for LTR retrotransposon plots with terminal branch length ages.

