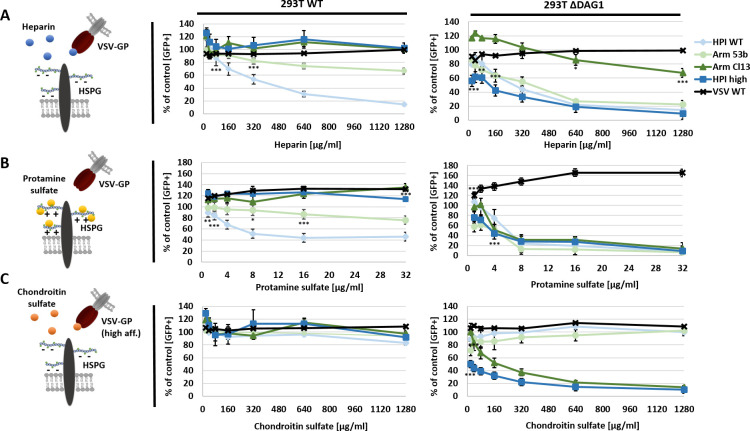
Fig 4. Treatment with soluble HS or PS efficiently inhibits infection of low affinity VSV-GP variants.
VSV WT or VSV-GP variants (MOI 1) were incubated with 0, 20, 40, 80, 160, 320, 640 or 1,280 μg/ml of soluble (A) HS or (C) CS for 2 h at 4°C in a total volume of 50 μl PBS and afterwards used to infect 293T WT or ΔDAG1 cells for 1 h at 37°C. To analyse the effect of (B) PS, cells were treated with 0, 1, 2, 4, 8, 16 or 32 μg/ml PS for 1 h at 37°C and subsequently infected with low or high affinity VSV-GP variants (MOI 1). Infection was quantified by flow cytometry measuring eGFP signal 15 h p.i. and is given relative to non-treated cells infected with the corresponding virus. Shown are the means ± SD of three replicates. Statistical analysis was performed using one-way ANOVA, followed by Turkey’s multiple comparison test; * p < 0.05, ** p < 0.001, *** p < 0.0001 (added below data points).

