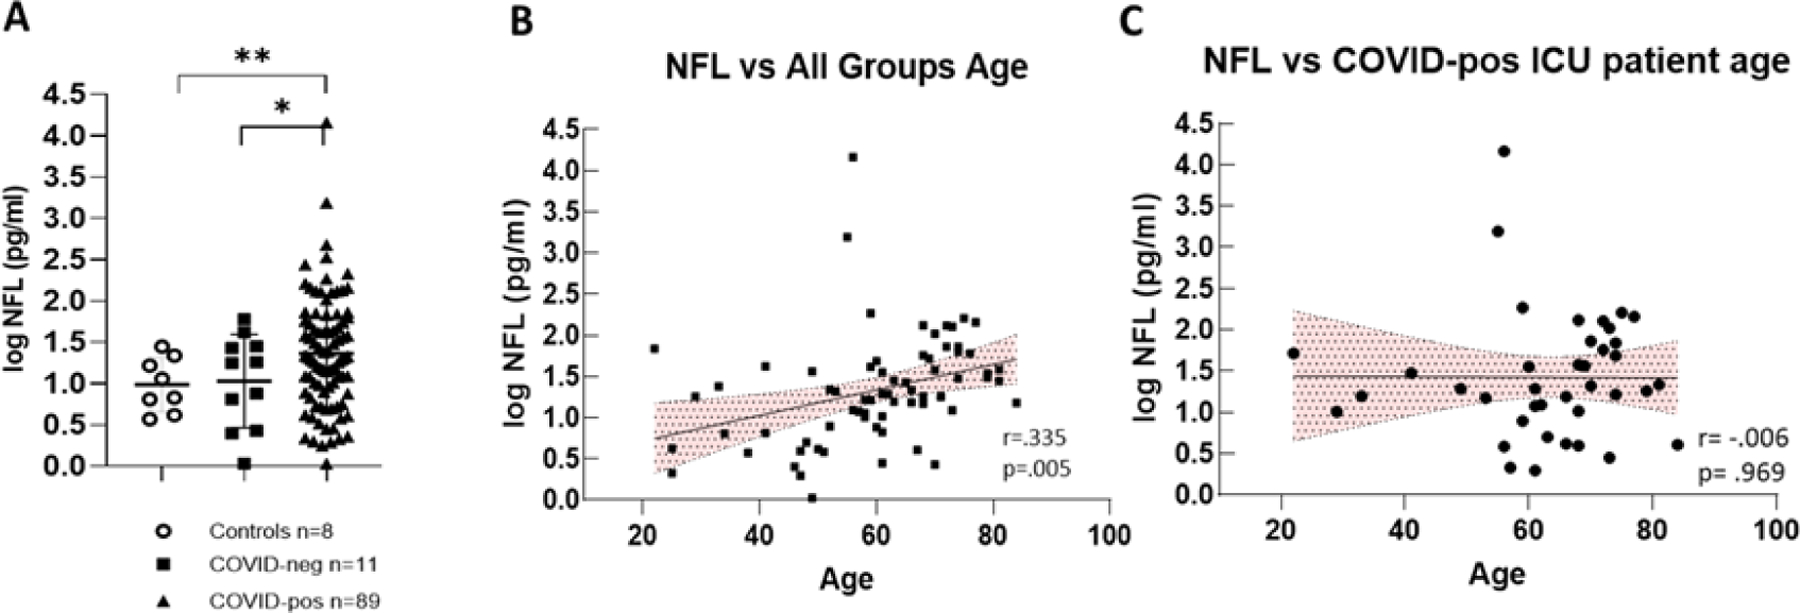
Figure 1:

(A) Illustrates log Nfl values from COVID-pos, COVID-neg ICU patients and healthy controls. COVID-pos mean plasma Nfl levels were 66.85±18.9 sem pg/ml, median of 19.8 pg/ml (max 1555-min 1.0 vs. COVID-neg, mean plasma Nfl levels were 19.3±5.6 sem pg/ml, median of 17.8 pg/ml (max 60.2-min 1.0), (95% CI 8.18 to 86.78, two-tailed Welch’s t-test, p = ,01). The 8 healthy controls had mean Nfl levels of 12.3±`3.1 sem pg/ml, median 9.0 pg/ml (max 27.9-min 3.7) and were significantly different from COVID-pos (95% CI 16.27 to 92.71, two-tailed Welches’t-test, p =.005). (B) Log Nfl levels and age from all the groups analyzed together show that log Nfl levels were significantly correlated to age in the combined groups, (r = .335, p =.005, Pearson). (C) COVID-pos ICU patient Nfl levels and age were analyzed separately and there was no significant correlation to age (r = .006, p = .969, Pearson).
