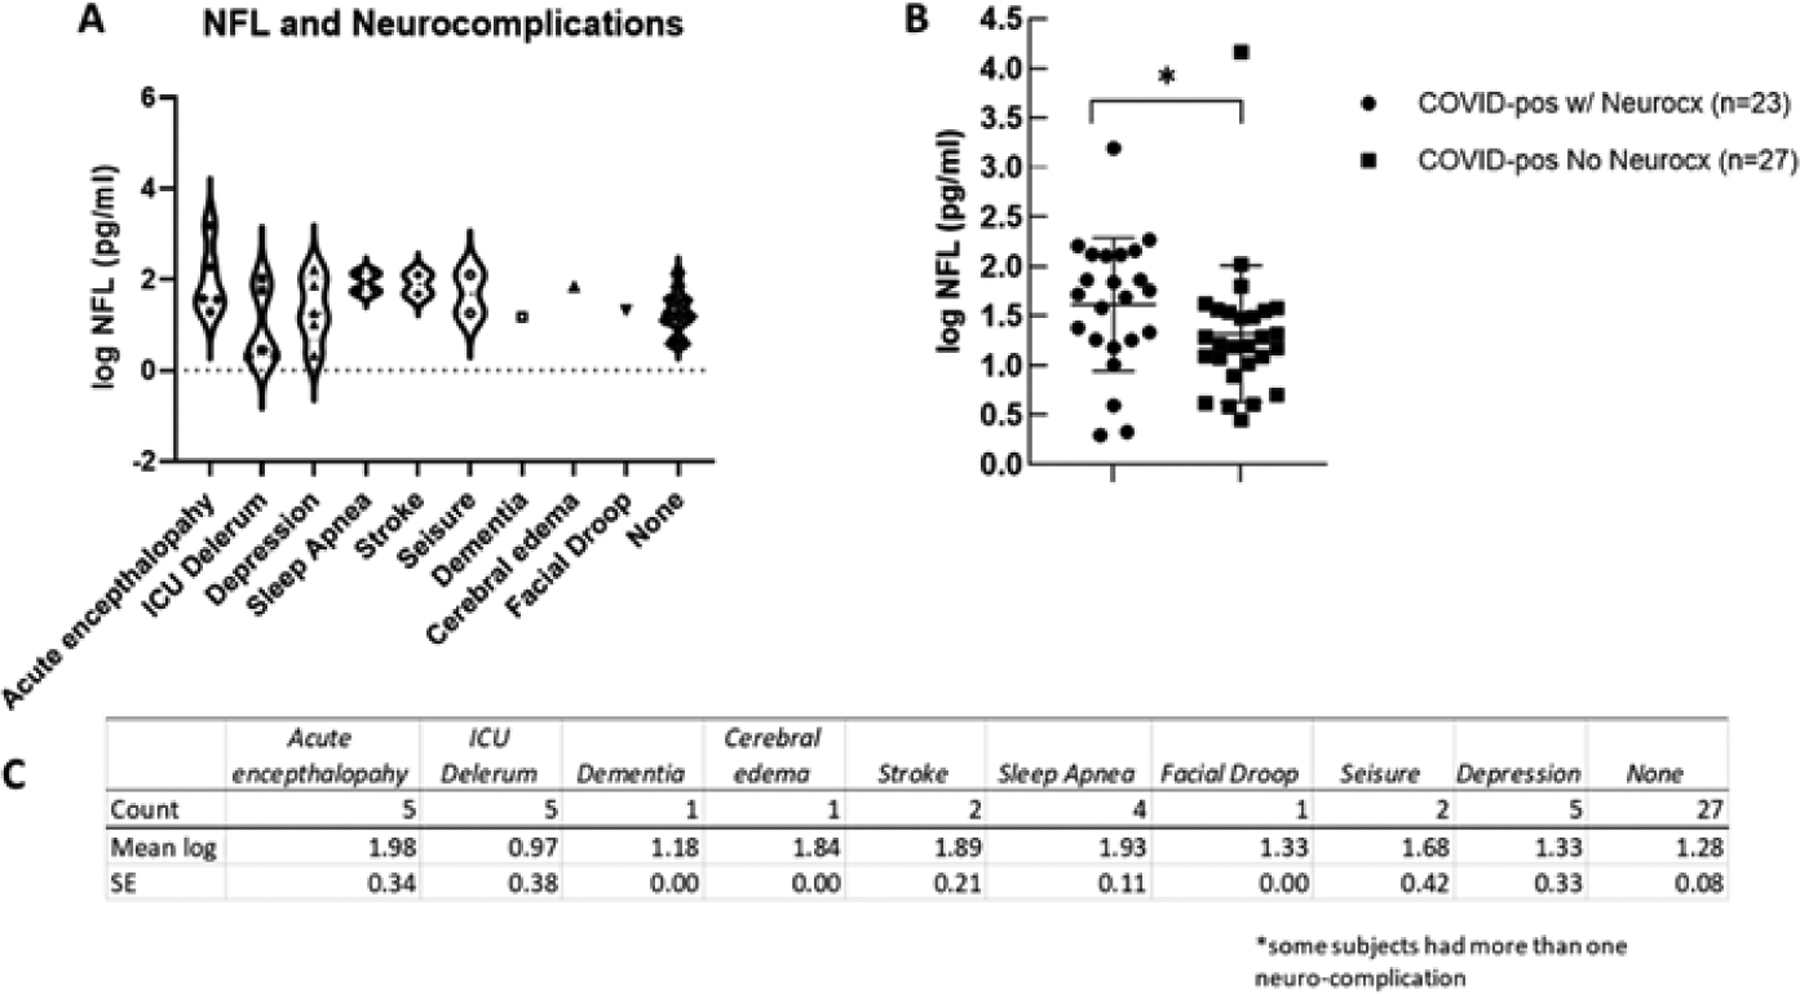
Figure 3:

(A) Illustrates the distribution and variance of neurological complications in COVID-pos patients plotted against the level of log Nfl for each neurological complication category. (B) Illustrates a significant difference of log Nfl levels in COVID-pos patients with neurological complications (1.6±0.1, median 1.7, min 0.29- max 3.1, n=23) to COVID-pos patients with no observed neurological complications (1.2±.07, median 1.2, min 0.4 – max 2.0, n=27), 95% CI 0.7 to .73, two-tailed Welch’s t-test, p =.01). (C) Is a table comparing the mean ± sem of log Nfl levels in each of the categories of neurological complication.
