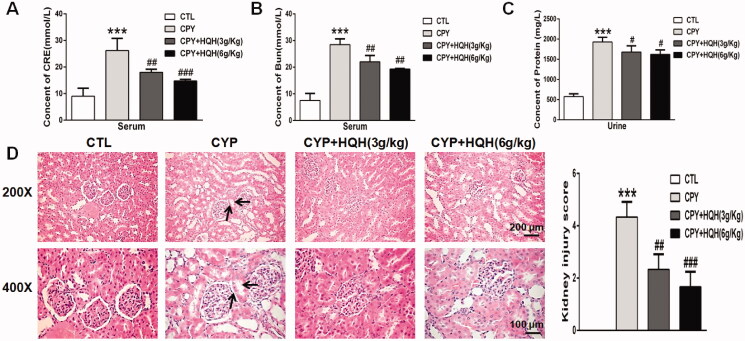
Figure 2.
Effects of HQH on functional marker and morphological change in the kidneys of CYP-treated rats. (A) Serum creatinine. (B) Blood urea nitrogen. (C) Urine protein. (D) Kidney sections stained with H&E (magnification ×200 and ×400). The data are presented as the mean ± SD. n = 4. ***p < 0.001 versus the Control group. #p < 0.05, ##p < 0.01, and ###p < 0.001 versus the CYP group.

