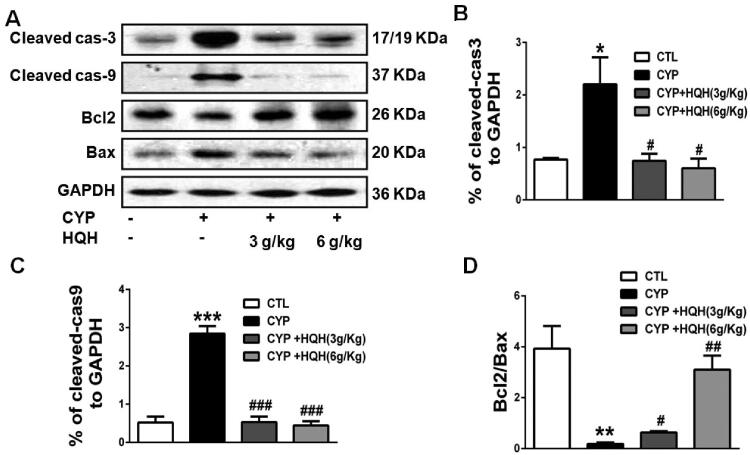
Figure 4.
Effect of HQH on the apoptosis-related protein levels in the kidneys of CYP-treated rats. Western blot was used to test the protein expressions. (A) Representative images of cleaved-caspase3, cleaved-caspase9, Bcl2 and Bax were shown. (B) The levels of cleaved-caspase3. (C) The levels of cleaved-caspase9. (D) The ratio of Bcl2/Bax. Data are shown as mean ± SD, n = 4. *p < 0.05 and ***p < 0.001 versus the Control group. #p < 0.05, ##p < 0.01 and ###p < 0.001 versus the CYP group.

