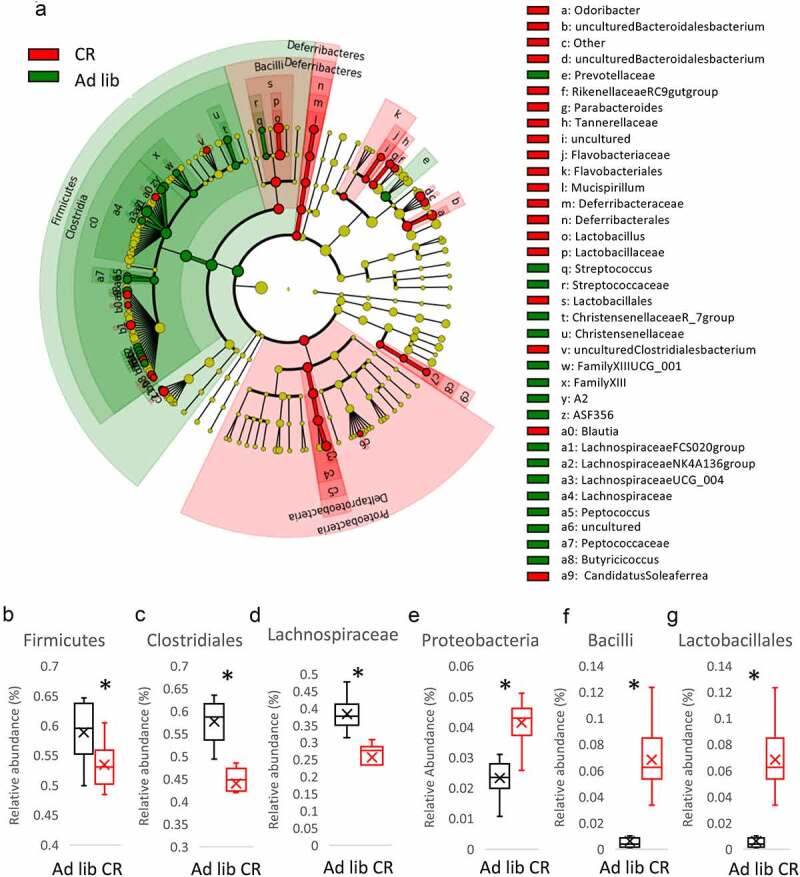
Figure 1.

Caloric restriction (CR) modifies microbiota composition in the cecum. Cecum microbiota was sequenced and the results are shown as a Cladogram representing the Linear discriminant analysis Effect Size (LEfSe) results on the hierarchy induced by the taxa. Only significantly changed taxa names with the corresponding color are shown. The figure presents results with a linear determinant analysis (LDA) score bigger than 2 and a p-value smaller than .05. (a). The abundance of Firmicutes (b), Clostridiales (c), Lachnospiraceae (d), Proteobacteria (e), Bacilli (f), and Lactobacillales (g) in the cecum of ad libitum and CR mice was presented. Two-tailed Student’s t-tests were used to compare the experimental groups of the panels B-G
