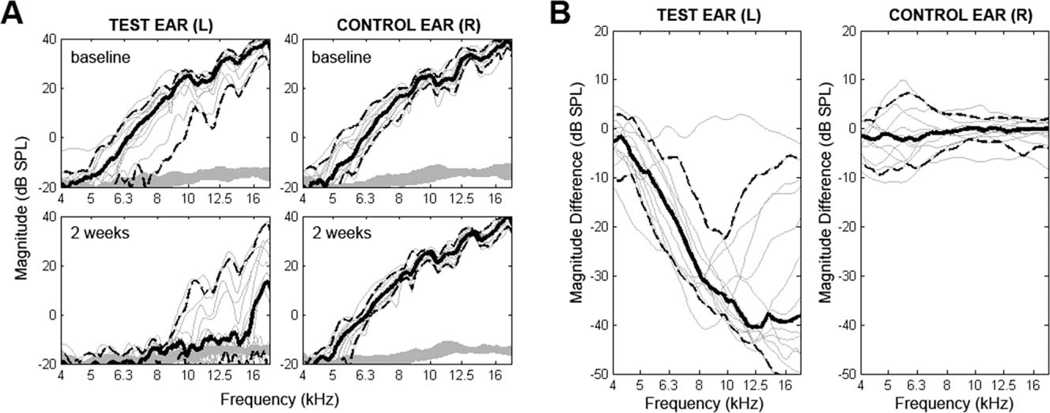
Fig. 6.
Pre- and postoperative distortion product otoacoustic emissions (DPOAE) results for test and contralateral ears. Plots show 2 f1 – f2 DPOAE magnitude (dB SPL) as a function of f2 frequency. Each thin line represents one subject. Solid bold lines represent subject averages in each condition with 95% confidence interval indicated by dashed lines. (A) Baseline and 2-week data are depicted. For the left implanted ear, amplitude of response decreased for every subject. Nine of 15 retained measureable responses above the noise floor. (B) The difference in DPOAE magnitude is plotted for each subject. For frequencies with a large preoperative signal-to-noise ratio, large decreases in magnitude of emissions are seen. Again, outer hair cell function is measureable in nine of 15 subjects. Minimal changes are seen in the contralateral ear.

