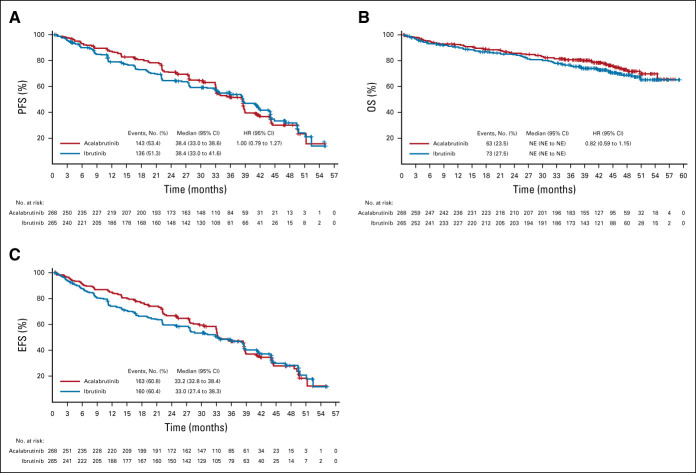
FIG 2.
PFS, OS, and EFS. (A) Kaplan-Meier curve of IRC-assessed PFS (primary end point). (B) Kaplan-Meier curve of OS (secondary end point). (C) Kaplan-Meier curve of IRC EFS. The Kaplan-Meier curves for IRC-assessed PFS cross at 33 months, indicating a violation of the proportional hazards assumption. A sensitivity analysis on the basis of RMST, which is valid under nonproportional hazards, confirmed that acalabrutinib was noninferior to ibrutinib, with a difference in RMST (acalabrutinib-ibrutinib) of 1.1 month (95% CI: −2.17 to 4.36) over 55 months. The lower bound of the 95% CI was compared with an RMST noninferiority margin of −5.83 months, derived from the HR noninferiority margin of 1.429. For the PFS analysis, three ibrutinib-treated patients were censored because of PD or death immediately after missing two or more consecutive visits, and seven acalabrutinib and eight ibrutinib patients were censored at random assignment because of no baseline assessment and/or no adequate postbaseline assessment. EFS, event-free survival; HR, hazard ratio; IRC, Independent Review Committee; NE, not estimable; OS, overall survival; PD, progressive disease; PFS, progression-free survival; RMST, restricted mean survival time.

