. 2021 Sep 15;10:e69508. doi: 10.7554/eLife.69508

Figure 1. Patterns of epigenetic modification across metabolism in Arabidopsis.

(A) Enrichment analysis shows different epigenetic modification patterns across metabolic domains. The heatmap represents log2 fold change (Log2FC) of enrichment or depletion of an epigenetic mark associated with each domain relative to total metabolic genes. Epigenetic modifications are color-coded based on their effect on gene expression; red represents activating mark and blue represents repressive mark. Genes only mapped to unique metabolic domains were included in this analysis. Significant enrichment or depletion is based on Fisher’s exact test, p-value < 0.05 and fold change >1.5. Gray cells represent no significant change. Black arrows indicate the patterns for trimethylation of lysine 27 of histone 3 (H3K27me3) and H3K18ac. (B) The co-occurrence of H3K27me3 and H3K18ac on total enzymatic genes in the genome and specialized metabolic genes.

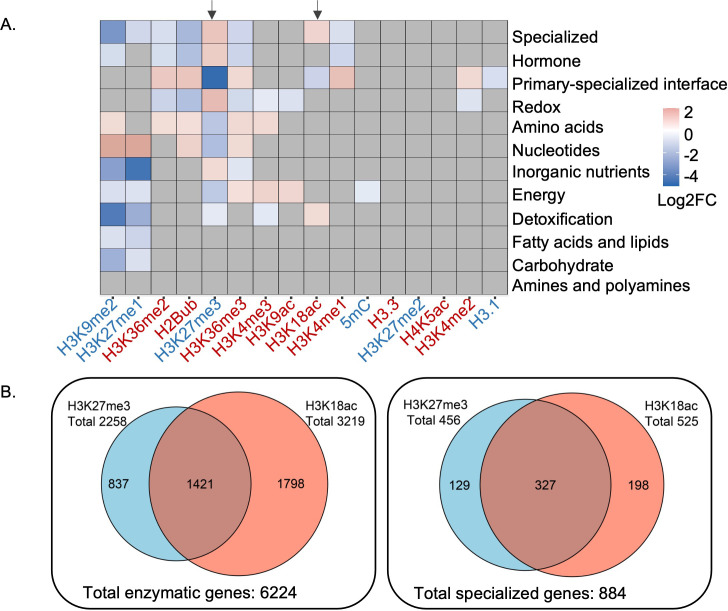
Figure 1—source data 1. Source data used to generate Figure 1A, B.

Figure 1.

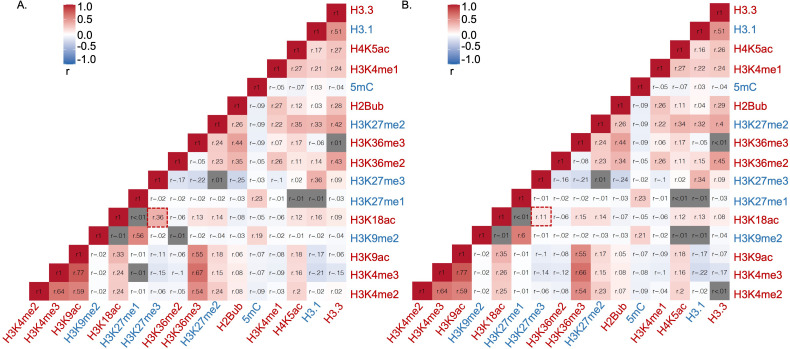
Figure 1—figure supplement 1. Correlation analysis of epigenetic marks based on their relative abundance on (A) total Arabidopsis metabolic genes, (B) non-specialized metabolic genes.

Figure 1—figure supplement 1.

Epigenetic modifications are color-coded based on their effect on gene expression; red represents activating mark and blue represents repressing mark. r represents Pearson’s correlation coefficient. The box highlighted by red represents Pearson’s correlation coefficient between H3K18ac and H3K27me3 . Gray cells represent insignificant correlation determined by the R package Hmisc.

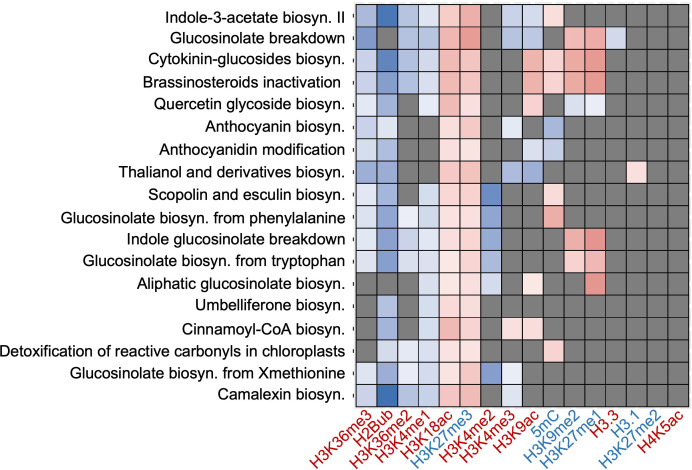
Figure 1—figure supplement 2. Epigenetic marks associated with pathways involved in specialized metabolism including camalexin biosynthesis.

Figure 1—figure supplement 2.

The heatmap represents log2 fold change (Log2FC) of enrichment or depletion of a mark associated with each pathway relative to total metabolic genes based on Fisher’s exact test followed by a post hoc adjustment using false discovery rate (FDR). Gray cells represent no-significant enrichment or depletion at FDR of 0.01 and fold change of 1.5. The heatmap was generated using hierarchical clustering using the ggplot2 package version 3.1 in RStudio. Epigenetic modifications are color-coded based on their effect on gene expression; red represents activating marks and blue represents repressive marks.