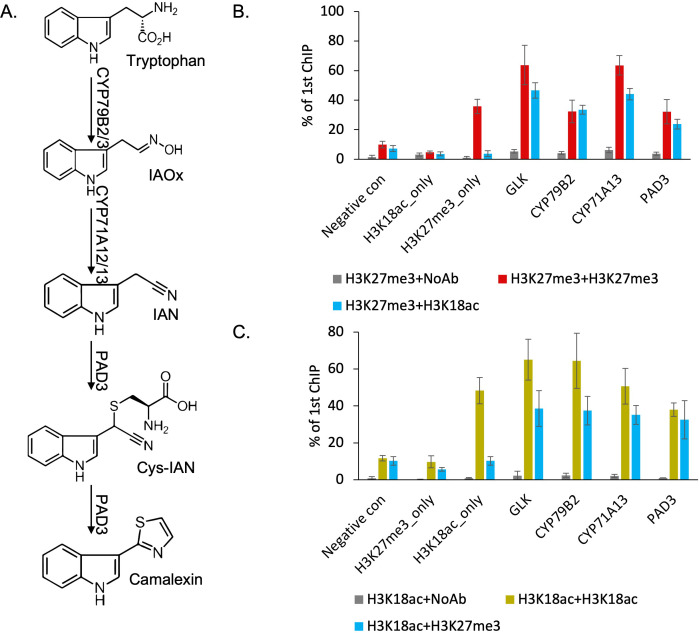
Figure 2. H3K27me3 and H3K18ac are co-localized on camalexin biosynthesis genes in planta to form a bivalent chromatin.
(A) Camalexin biosynthesis pathway map and the essential genes that can produce camalexin. (B-C) Sequential chromatin immunoprecipitation (ChIP)-qPCR confirms the co-localization of H3K27me3 and H3K18ac. Altering the order of antibodies against H3K27me3 or H3K18ac in two rounds of pull-downs shows similar results in sequential ChIP-qPCR. Negative control represents a genomic region that has low abundance of both H3K27me3 and H3K18ac. H3K27me3_only represents a genomic region that has high abundance of H3K27me3 and low abundance of H3K18ac. H3K18ac_only represents a genomic region that has high abundance of H3K18ac and low abundance of H3K27me3. NoAb represents no antibody in the second pull-down. Error bars represent standard deviation of data from six biological replicates. The experiments were performed twice with different plant samples and data were combined in this analysis.

