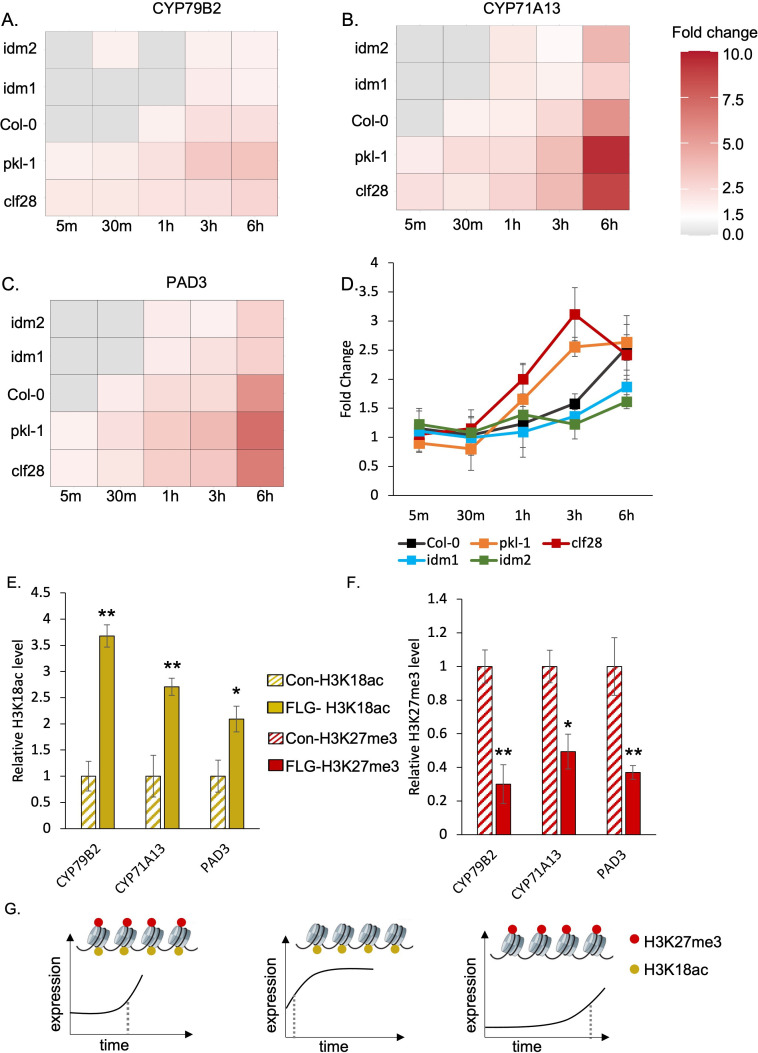
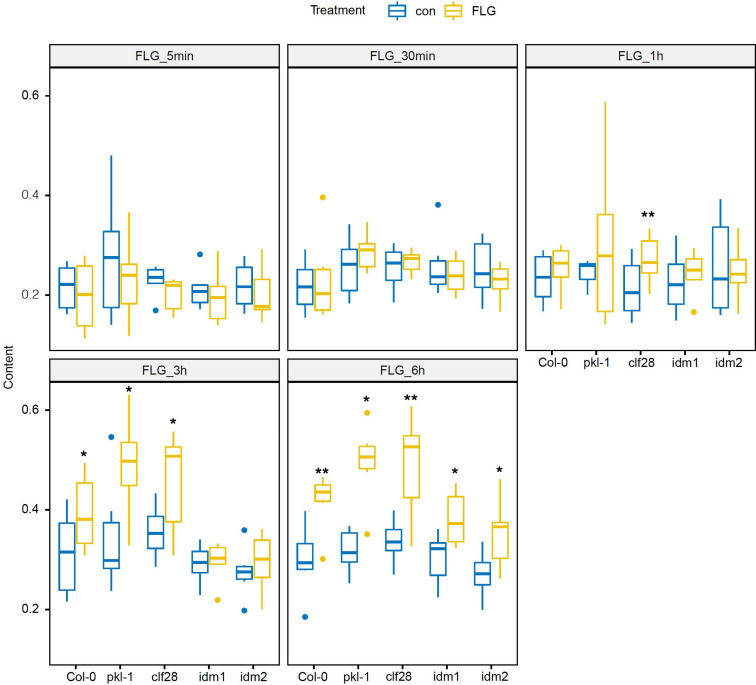
Figure 3. H3K27me3-H3K18ac bivalent chromatin controls the timing of gene induction and camalexin accumulation upon a pathogen signal.
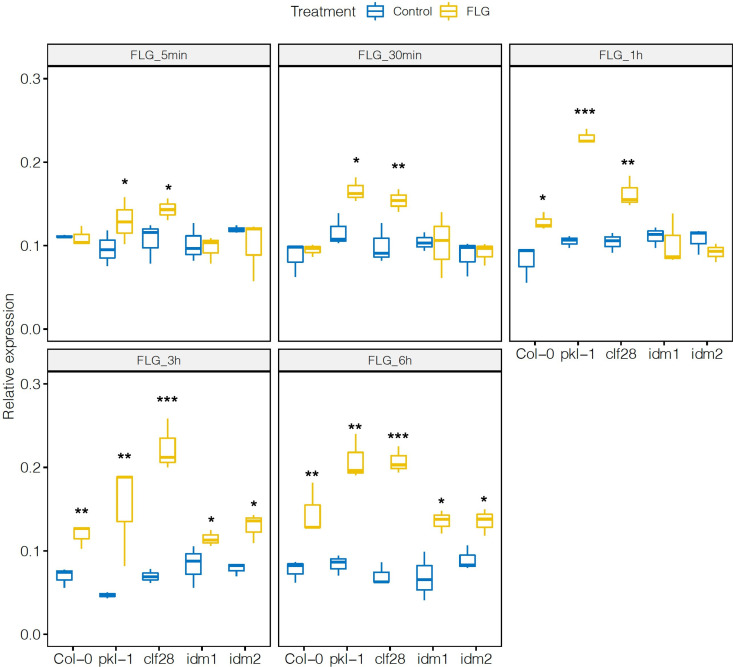
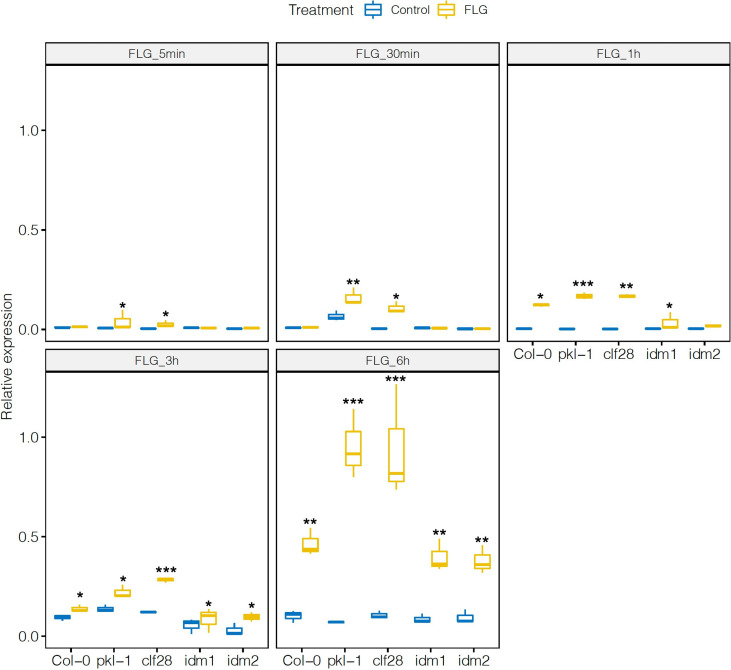
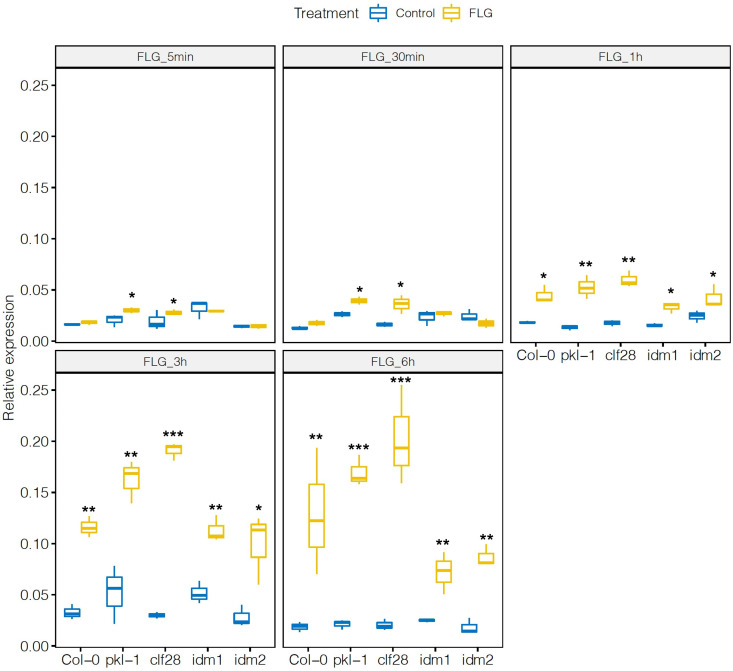
(A-C) Expression of the three essential genes in camalexin biosynthesis in response to flagellin 22 (FLG22) in the wild type (Col-0), H3K27me3-defective mutants clf28 and pkl-1, and H3K18ac-defective mutants idm1 and idm2. ACT2 was used as a reference gene. Relative gene expression at each time point was reported in Supplementary file 3 to 5. Fold change represents the induction level of camalexin biosynthesis genes in each genotype under FLG22 treatment relative to their corresponding untreated controls at each time point. (D) Camalexin accumulation in the wild type and mutants in response to FLG22. Camalexin content at each time point was reported in Supplementary file 6. Error bars represent standard deviation of data from six biological replicates of two experiments. (E-F) Abundance of epigenetic modifications at the genomic regions of camalexin biosynthesis genes with or without FLG22 treatment. Con-H3K18ac = chromatin was extracted from water-treated samples (Col-0) and pulled down by the antibody against H3K18ac. FLG-H3K18ac = chromatin was extracted from FLG22-treated samples (Col-0) and pulled down by the antibody against H3K18ac. Con-H3K27me3 = chromatin was extracted from water-treated samples (Col-0) and pulled down by the antibody against H3K27me3. FLG-H3K27me3 = chromatin was extracted from FLG22-treated samples (Col-0) and pulled down by the antibody against H3K27me3. Relative abundance of each modification was calculated by normalizing first to input, then to control plants with mock treatment. Two-week-old Arabidopsis seedlings of Col-0 were treated with 1 µM FLG22 or deionized water in these experiments. Stressed and control samples were collected 30 min after the treatment. Error bars represent standard deviation of data from six biological replicates of two experiments. * and ** represent p-values < 0.05 and 0.01, respectively, from Student’s two-tailed t-test. (G) A model of the H3K27me3-H3K18ac bivalent chromatin that acts as a kairostat to regulate the temporal pattern of gene expression in response to external stimuli. Upon a pathogen signal, bivalent chromatin controls the timing of induction for camalexin biosynthetic genes, with H3K18ac expediting and H3K27me3 attenuating expression to hit the presumed temporal ‘sweet spot’. Dashed lines represent the time of significant gene induction.

