. 2021 Oct 26;10:e65580. doi: 10.7554/eLife.65580

Figure 3. Inhibition of acetylcholine (ACh) release from medial septum/diagonal band of Broca (MSDB) ChAT+ neurons impairs social novelty but not object recognition.

(A) Top: schematic illustration of the sociability task in the three-chamber test. Bottom: representative heat map showing the time spent by an eYFP (left) or a TeNT (right) mouse in exploring the animal (left) and the object (right). (B) Left: aligned dot plot showing interaction time spent to explore the animal and the object during sociability task in eYFP (control, green, n = 9) and TeNT mice (orange, n = 11) (eYFP: 187 ± 12 vs 121 ± 7.7 s, p = 0.018; TeNT: 197 ± 20 vs 127 ± 12 s, p = 0.005; one-way ANOVA). Right: aligned dot plot showing the sociability score in eYFP (control, green, n = 9) and TeNT mice (orange, n = 11) (eYFP: 66.8 ± 15 s; TeNT: 70.5 ± 21 s, p = 0.94; Mann–Whitney test). (C) Top: schematic illustration of the social novelty task in the three-chamber test. Bottom: representative heat map showing the time spent by an eYFP (left) or a TeNT (right) mouse in exploring the novel animal (left) and the familiar one (right). (D) Left: aligned dot plot showing interaction time spent to explore the novel and the familiar animal in the social novelty task in eYFP (control, green, n = 9) and TeNT (orange, n = 11) mice (eYFP: 145 ± 10 vs 81.2 ± 10 s, p = 0.002; TeNT: 79.8 ± 13 vs 101 ± 10 s, p = 0.47; one-way ANOVA). Right: aligned dot plot showing the social novelty score in eYFP (control, green, n = 9) and TeNT (orange, n = 11) mice (eYFP: 64.1 ± 12 s; TeNT: −21.7 ± 5.8 s, p < 0.0001; Mann–Whitney test). (E) Top: schematic illustration of the novel object recognition (NOR) test. Bottom: representative heat map showing the time spent by an eYFP (left) or a TeNT (right) mouse in exploring the novel (left) and the familiar (right) object. (F) Left: aligned dot plot showing the exploration time spent to explore the familiar and the novel object during NOR task in eYFP (control, green, n = 11) and TeNT (orange, n = 12) mice (eYFP: 76.6 ± 8.8 vs 39 ± 3.6 s, p = 0.03; TeNT: 99.9 ± 16 vs 37.6 ± 9.8 s, p = 0.0002; one-way ANOVA). Right: aligned dot plot showing the exploration score in eYFP (control, green, n = 11) and TeNT (orange, n = 12) mice (eYFP: 37.6 ± 9.8 s; TeNT: 62.7 ± 17 s, p = 0.38; Mann–Whitney test). Open circles are values from single animals and bars are mean ± SEM. *: p < 0.05; **: p < 0.01; ***: p < 0.001.

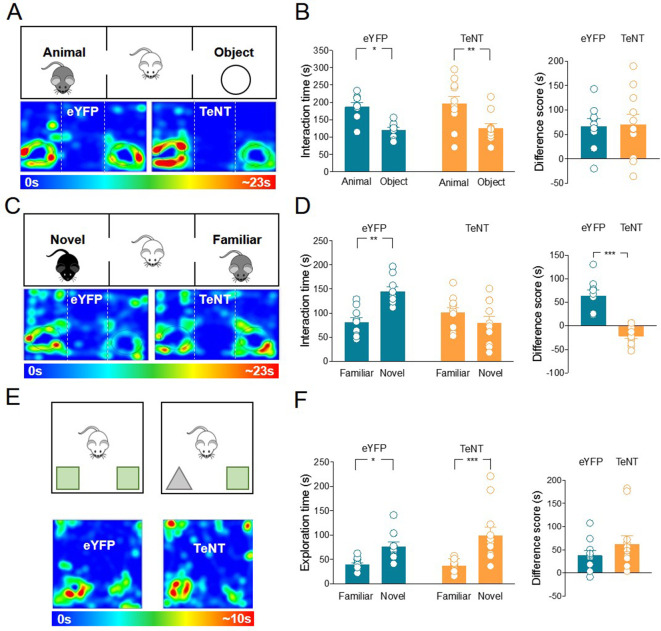
Figure 3—source data 1. Interaction times and scores for three-chamber and novel object recognition tests.

Figure 3.

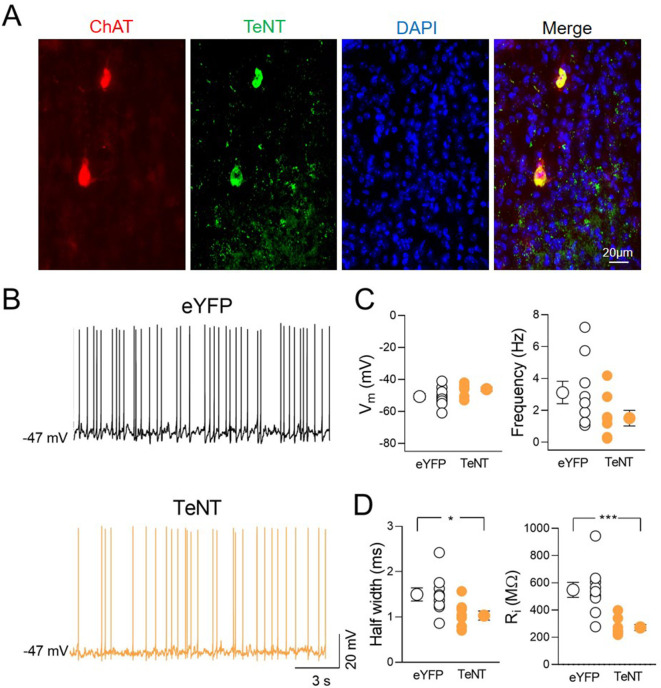
Figure 3—figure supplement 1. Intrinsic properties of TeNT-expressing ChAT+ neurons in the medial septum/diagonal band of Broca (MSDB).

Figure 3—figure supplement 1.

(A) Confocal fluorescent images illustrating (from left to right): ChAT immunostaining, TeNT-GFP, nuclear-staining DAPI, and merge image of MSDB neurons. (B) Sample traces showing the spontaneous firing recorded from ChAT+ neurons expressing eYFP (black) or TeNT (orange). (C) Aligned dot plots showing Vm (left) and spontaneous firing frequency (right) of eYFP (control, black, n = 9)- and TeNT (orange, n = 8)-expressing neurons in the MSDB (Vm: eYFP, −50.7 ± 1.9 mV and TeNT, −46.1 ± 1.3 mV; p = 0.09; frequency: eYFP, 3.1 ± 0.7 Hz and TeNT, 1.51 ± 0.5 Hz; p = 0.07; Mann–Whitney test). (D) Aligned dot plots showing the half-width (left) and the input resistance (Ri, right) of eYFP (control, black, n = 9)- and TeNT (orange, n = 8)-expressing neurons in the MSDB (half-width: eYFP, 1.5 ± 0.1 ms and TeNT, 1.03 ± 0.1 ms; p = 0.011; Ri: eYFP, 549 ± 62 MΩ and TeNT, 272 ± 23 MΩ; p = 0.0006; Mann–Whitney test). Open or closed circles represent values from single cells. Laterally located circles represent mean ± SEM. *: p < 0.05; ***: p < 0.001.
Figure 3—figure supplement 2. TeNT expression in ChAT+ neurons in the medial septum/diagonal band of Broca (MSDB) does not affect locomotor activity.

Figure 3—figure supplement 2.

(A) Schematic illustration of the open-field arena with the outer zone (yellow, left) and the inner zone (green, right). (B) Aligned dot plot showing the total distance traveled by eYFP (control, green, n = 8) and TeNT (orange, n = 10) mice during the open-field test (distance: eYFP, 35.2 ± 3.5 m; TeNT, 37.2 ± 1.3 m, p = 0.69). (C) Aligned dot plot showing the speed reached by eYFP (control, green, n = 8) and TeNT (orange, n = 10) mice (speed: eYFP, 0.059 ± 0.006 m/s; TeNT, 0.061 ± 0.002 m/s, p = 0.63). (D) Aligned dot plots showing the time spent in the inner (inner time: eYFP, 36.1 ± 7.1 s; TeNT, 29 ± 3 s, p = 0.41; Mann–Whitney test) and outer (outer time: eYFP, 564 ± 7.1 s; TeNT, 571 ± 3 s, p = 0.39) zones by eYFP (control, green, n = 8) and TeNT mice (orange, n = 10). (E) Schematic illustration of the three-chamber apparatus. (F) Aligned dot plots showing the distance traveled (left) and the speed reached (right) by eYFP (control, green, n = 9) and TeNT (orange, n = 11) mice (distance: eYFP, 30.6 ± 2.2 m; TeNT, 26.6 ± 1.9 m, p = 0.20; speed: eYFP, 0.052 ± 0.003 m/s; TeNT, 0.046 ± 0.004 m/s, p = 0.27; Mann–Whitney test). Open circles represent values from single animals and bars are mean ± SEM.