. 2021 Oct 26;10:e65580. doi: 10.7554/eLife.65580

Figure 7. nAChR-mediated modulation of synaptic transmission in CA2.

(A) Sample traces showing spontaneous excitatory postsynaptic currents (sEPSCs) of a CA2 pyramidal neuron recorded at ECl in control (black) and in the presence of nicotine (1 μM; orange). (B) Aligned dot plots showing the mean frequency (left) and amplitude (right) of sEPSCs recorded from CA2 pyramidal neurons in control (black) and in the presence of nicotine (1 μM; orange) (n = 13 cells; frequency: control: 0.81 ± 0.1 Hz, Nic: 1.5 ± 0.2 Hz; p = 0.0005; amplitude: control: 19.9 ± 1.4 pA, Nic: 19.7 ± 0.8 pA; p = 0.76; Wilcoxon test). (C) Sample traces showing sEPSCs of a CA2 pyramidal neuron recorded at ECl in the presence of α7 nAChR antagonist methyllycaconitine (MLA, (10 nM; black)) and in the presence of MLA plus nicotine (1 μM; orange). (D) Aligned dot plots showing the mean frequency (left) and amplitude (right) of sEPSCs recorded from CA2 pyramidal neurons in the presence of MLA (10 nM; black) and in the presence of MLA plus nicotine (1 μM; orange) (n = 9 cells; frequency: MLA: 1.9 ± 0.3 Hz, MLA+ Nic: 1.7 ± 0.2 Hz; p = 0.34; amplitude: MLA: 15.9 ± 1.1 pA, MLA+ Nic: 17.3 ± 1.0 pA; p = 0.36; Wilcoxon test). (E) Sample traces showing sEPSCs of a CA2 pyramidal neuron recorded at ECl in the presence of non-α7 nAChR antagonist dihydro-β-erythroidine (DHβE, 0.5 μM; black) and in the presence of DHβE plus nicotine (1 μM; orange). (F) Aligned dot plots showing the mean frequency (left) and amplitude (right) of sEPSCs recorded from CA2 pyramidal neurons in the presence of DHβE (0.5 μM; black) or DHβE plus nicotine (1 μM; orange) (n = 9 cells; frequency: DHβE: 0.9 ± 0.1 Hz, DHβE + Nic: 1.05 ± 0.3 Hz; p > 0.99; amplitude: DHβE: 16.3 ± 1.5 pA, DHβE + Nic: 18.2 ± 1.2 pA; p = 0.25; Wilcoxon test). Open or closed circles represent values from single cells. Laterally located circles represent mean ± SEM. ***: p < 0.001.

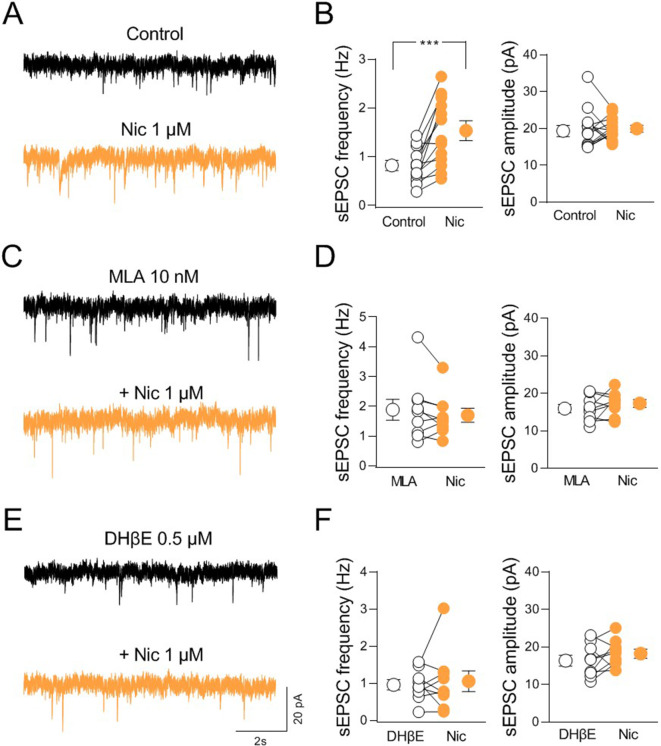
Figure 7—source data 1. Frequency and amplitude of spontaneous excitatory postsynaptic currents .

Figure 7.

Figure 7—figure supplement 1. nAChR-mediated modulation of miniature synaptic events in CA2.

Figure 7—figure supplement 1.

(A) Sample traces showing miniature inhibitory and excitatory postsynaptic currents (mIPSCs) from a CA2 pyramidal neuron before (black) and in the presence of nicotine (Nic 1 µM; orange). (B) Aligned dot plots showing the mean frequency (left) and amplitude (right) of mIPSC recorded from CA2 pyramidal neurons in control (black) and in the presence of nicotine (1 µM; orange) (n = 7 cells; frequency: control: 1.5 ± 0.2 Hz, Nic: 1.2 ± 0.1 Hz; p = 0.03; amplitude: control: 19.2 ± 1.4 pA, Nic: 19.8 ± 0.9 pA; p = 0.69; Wilcoxon test). (C) Sample traces showing mEPSCs from a CA2 pyramidal neuron in control (black) and in the presence of nicotine (Nic 1 µM; orange). (D) Aligned dot plots showing the mean frequency (left) and amplitude (right) of mEPSCs recorded from CA2 pyramidal neurons in control (black) and in the presence of nicotine (Nic 1 µM; orange) (n = 8 cells; frequency: control: 0.37 ± 0.05 Hz, Nic: 0.32 ± 0.05 Hz; p = 0.72; amplitude: control: 16.4 ± 0.6 pA, Nic: 16.3 ± 1.3 pA; p = 0.69; Wilcoxon test). Open or closed circles represent values from single cells. Laterally located circles represent mean ± SEM. *: p < 0.05.
Figure 7—figure supplement 2. nAChR-mediated modulation of synaptic transmission in CA3 and CA1 regions.

Figure 7—figure supplement 2.

(A) Sample traces showing spontaneous excitatory postsynaptic currents (sEPSCs) of a CA3 pyramidal neuron in control (black) and in the presence of nicotine (1 µM; orange) recorded at ECl. (B) Aligned dot plots showing the mean frequency (left) and amplitude (right) of sEPSCs recorded from CA3 pyramidal neurons in control (black) and in the presence of nicotine (1 µM; orange) (n = 9 cells; frequency: control: 5.3 ± 0.7 Hz, Nic: 4.1 ± 0.6 Hz; p = 0.004; amplitude: control: 27.1 ± 1.6 pA, Nic: 27.2 ± 2.2 pA; p = 0.9; Wilcoxon test). (C) Sample traces showing sEPSCs of a CA1 pyramidal neuron in control (black) and in the presence of nicotine (1 µM; orange) recorded at ECl. (D) Aligned dot plots showing the mean frequency (left) and amplitude (right) of sEPSCs recorded from CA1 pyramidal neurons in control (black) and in the presence of nicotine (1 µM; orange) (n = 10 cells; frequency: control: 1.7 ± 0.5 Hz, Nic: 1.3 ± 0.4 Hz; p = 0.039; amplitude: control: 20.3 ± 1.3 pA, Nic: 19.4 ± 0.7 pA; p = 0.9; Wilcoxon test). Open or closed circles represent values from single cells. Laterally located circles represent mean ± SEM. *: p < 0.05; **: p < 0.01.