. 2021 Oct 26;10:e65580. doi: 10.7554/eLife.65580

Figure 9. Photoactivation of ChAT+ neurons in medial septum/diagonal band of Broca (MSDB) controls CA2 output.

(A) Schematic illustration showing the experimental settings of in vivo juxtacellular recordings combined with light stimulation of MSDB ChAT+ neurons expressing channelrhodopsin (ChR2). (B) Representative trace showing spontaneous firing from a CA2 bursting neuron in control (black) and during ChR2 activation (blue) via light pulses (below the trace). (C) Individual bursts in (B) (asterisk and hashtag for control and light activation, respectively) shown on an expanded time scale. (D) Left: aligned dot plot showing the frequency of spikes in control (black) and during light activation of ChAT+ neurons in the MSDB (blue) (n = 9 cells; control: 3.62 ± 1.0 Hz; light: 4.26 ± 0.97 Hz; p = 0.012, Wilcoxon test); right: aligned dot plot showing the frequency of spikes within the bursts in control and during light activation of ChAT+ neurons in the MSDB (n = 9 cells; control: 118 ± 19 Hz; light: 114 ± 20 Hz; p = 0.36, Wilcoxon test). Open circles represent values from single cells. Closed circles represent mean ± SEM. **: p = 0.01.

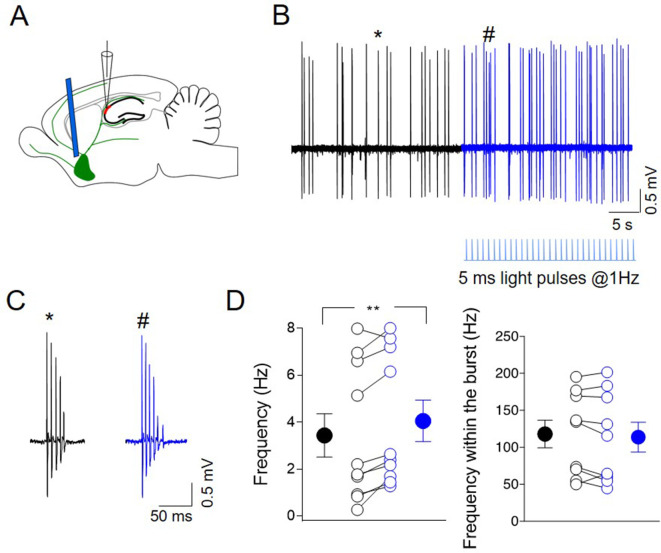
Figure 9—source data 1. Spike analysis.

Figure 9.

Figure 9—figure supplement 1. Light delivery in MSDB combined with CA2 recordings in not injected or ChR2-expressing mice under ketamine–xylazine anesthesia.

Figure 9—figure supplement 1.

(A) Schematic illustration showing the experimental settings of in vivo juxtacellular recordings in animals not expressing channelrhodopsin (ChR2) combined with light delivery in the medial septum/diagonal band of Broca (MSDB). (B) Representative trace showing spontaneous firing from a CA2 bursting neuron in control (black) and during light delivery (blue; below the trace). (C) Individual bursts in (B) (asterisk and hashtag for control and light activation, respectively) shown on an expanded time scale. (D) Left: aligned dot plot showing the frequency of spikes in control (black) and during light delivery in the MSDB (blue) (n = 9 cells; control: 3.3 ± 0.8 Hz; light: 3.03 ± 0.7 Hz; p = 0.38, Wilcoxon test). Right: aligned dot plot showing the frequency of the spikes within the bursts in control and during light delivery in the MSDB (n = 9 cells; control: 86.6 ± 18 Hz; light: 82.4 ± 17 Hz; p = 0.46; Wilcoxon test). (E) Schematic illustration showing the experimental settings of in vivo juxtacellular recordings combined with light stimulation of MSDB ChAT+ neurons expressing channelrhodopsin (ChR2) under ketamine–xylazine anesthesia. (F) Representative trace showing spontaneous firing from a CA2 bursting neuron in control (black) and during ChR2 activation (blue) via light pulses (below the trace). (G) Individual bursts in (F) (asterisk and hashtag for control and light activation, respectively) shown on an expanded time scale. (H) Left: aligned dot plot showing the frequency of spikes in control (black) and during light activation of ChAT+ neurons in the MSDB (blue) (n = 8 cells; control: 2.53 ± 0.7 Hz; light: 3.58 ± 0.8 Hz; p = 0.016, Wilcoxon test). Right: aligned dot plot showing the frequency of the spikes within the bursts in control and during light delivery in the MSDB (n = 8 cells; control: 102 ± 17 Hz; light: 93.4 ± 17 Hz; p = 0.11; Wilcoxon test). Open circles represent values from single cells. Closed circles represent mean ± SEM. *: p < 0.05.
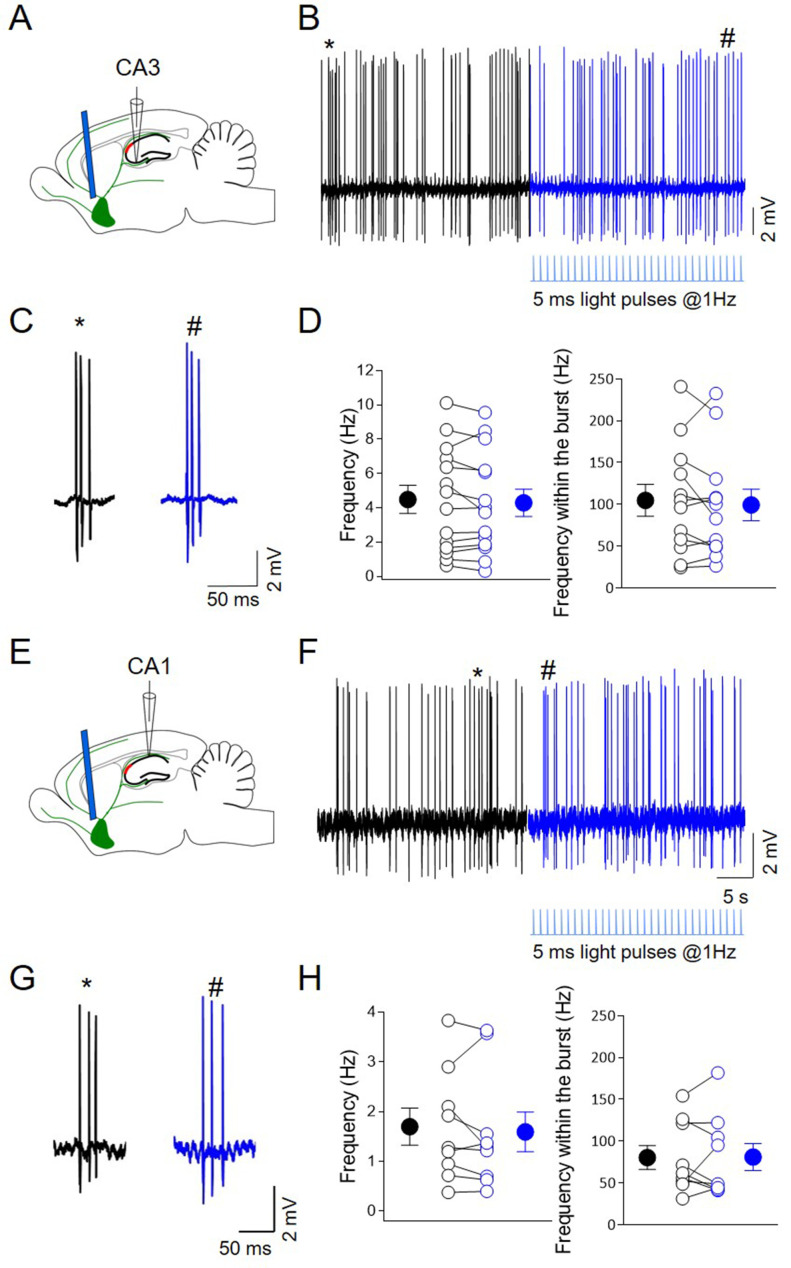
Figure 9—figure supplement 2. Photoactivation of ChAT+ neurons in MSDB does not affect CA3 and CA1 output.

Figure 9—figure supplement 2.

(A) Schematic illustration showing the experimental settings of in vivo juxtacellular recordings from CA3 region combined with light stimulation of medial septum/diagonal band of Broca (MSDB) ChAT+ neurons expressing channelrhodopsin (ChR2). (B) Representative trace showing spontaneous firing from a CA3 bursting neuron in control (black) and during light delivery (blue; below the traces). (C) Individual bursts in (B) (asterisk and hashtag for control and light activation, respectively) shown on an expanded time scale. (D) Left: aligned dot plot showing the frequency of spikes in control (black) and during light activation of ChAT+ neurons in the MSDB (blue) (n = 14 cells; control: 4.5 ± 0.82 Hz; light: 4.3 ± 0.8 Hz; p = 0.24; Wilcoxon test). Right: aligned dot plot showing the frequency of spikes within the bursts in control and during light delivery in the MSDB (n = 14 cells; control: 105 ± 19 Hz; light: 99.4 ± 19 Hz; p = 0.52; Wilcoxon test). (E) Schematic illustration showing the experimental settings of in vivo juxtacellular recordings from CA1 region combined with light stimulation of MSDB ChAT+ neurons expressing channelrhodopsin (ChR2). (F) Representative trace showing spontaneous firing from a CA1 bursting neuron in control (black) and during light delivery (blue; below the traces). (G) Individual bursts in (F) (asterisk and hashtag for control and light activation, respectively) shown on an expanded time scale. (H) Left: aligned dot plot showing the frequency of spikes in control (black) and during light activation of ChAT+ neurons in the MSDB (blue) (n = 9 cells; control: 1.7 ± 0.4 Hz; light: 1.59 ± 0.4 Hz; p = 0.3; Wilcoxon test). Right: aligned dot plot showing the frequency of spikes within the bursts in control and during light delivery in the MSDB (n = 9 cells; control: 80.4 ± 14 Hz; light: 81 ± 16 Hz; p = 0.91; Wilcoxon test). Open circles represent values from single cells. Closed circles represent mean ± SEM.