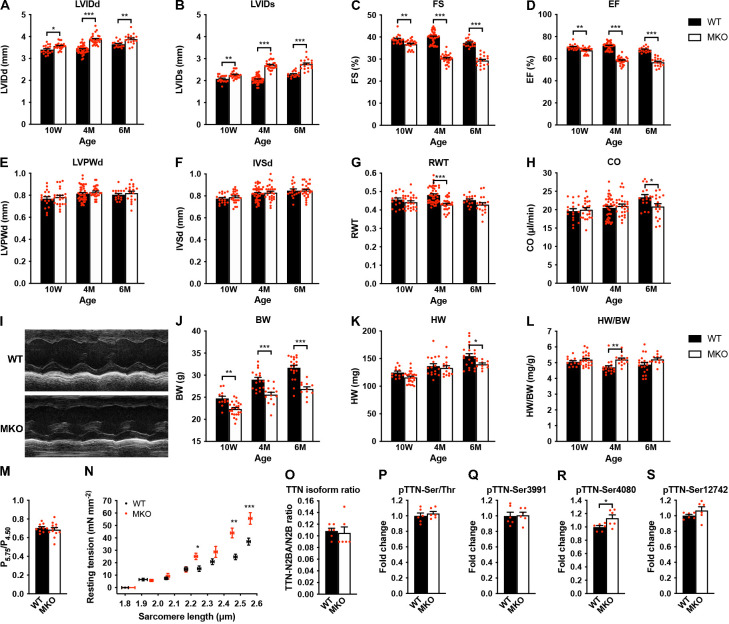
Figure 3. Echocardiographic analyses and sarcomere-length-tension relationship in cardiac myofibrils from wild-type (WT) and myopalladin knockout (MKO) mice.
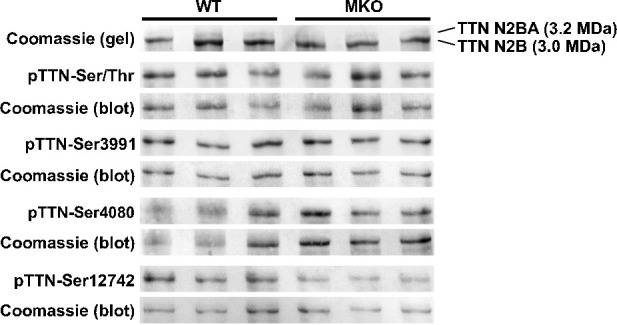
(A–H) Echocardiographic analysis of WT and MKO male mice at 10 weeks (10 W), 4 months (4 M), and 6 months (6 M) of age. LVID, left ventricular inner diameter; FS, fractional shortening; EF, ejection fraction; LVPW, left ventricular posterior wall thickness; IVS, interventricular septum thickness; RWT, relative wall thickness ((LVPWd + IVSd)/LVIDd); CO, cardiac output; d, diastole; s, systole. Data are represented as mean ± standard error of the mean (SEM) (n = 16–42 per group). *p < 0.05; **p < 0.01; ***p < 0.001; two-way analysis of variance (ANOVA) with Bonferroni’s multiple comparison test. (I) Representative echocardiographic short-axis M-mode images from hearts of 6-month-old WT and MKO male mice. (J–L) Body weight (BW) (J), heart weight (HW) (K), and heart weight to body weight ratio (HW/BW) (L) of WT and MKO male mice at 10 W, 10 M, and 6 M of age. Data are represented as mean ± SEM (n = 12–24 per group). *p < 0.05; **p < 0.01; ***p < 0.001; two-way ANOVA with Bonferroni’s multiple comparison test. (M) Ratio of tension measured at pCa 5.75 (P5.75, submaximal activation) vs. pCa 4.50 (P4.50, maximal activation) in WT and MKO myofibrils using Ca2+ jump protocols. Data are represented as mean ± SEM (n = 10 myofibrils from two WT mice and 12 myofibrils from two MKO mice). (N) Average sarcomere-length-tension relationship in cardiac myofibrils from the left ventricle of 4-month-old WT and MKO male mice. Each data point is represented as mean ± SEM from 10 myofibrils from three WT mice and 16 myofibrils from three MKO mice. *p < 0.05; **p < 0.01; ***p < 0.001; unpaired Student’s t-test. (O–S) Densitometric analysis for (O) titin (TTN) N2BA/N2B isoform ratio as determined by sodium dodecyl sulfate (SDS)-PAGE and Coomassie blue staining, (P) titin serine/threonine phosphorylation as determined by Western blot analysis using anti-phosphoserine/threonine antibody, and (Q–R) site-specific titin phosphorylation on Ser3991 (corresponding to human pTTN-Ser4010, phosphorylated by PKA and ERK2) (Q), Ser4080 (corresponding to human pTTN-Ser4099, phosphorylated by PKG) (R), and Ser12742 (corresponding to human pTTN-Ser11878, phosphorylated by PKCα) (S) using titin phosphosite-specific antibodies. Normalization was performed to total protein content as determined by Coomassie blue staining of each blot. Data are represented as mean ± SEM (n = 6 per group). *p < 0.05; unpaired Student’s t-test.
Figure 3—figure supplement 1. Titin isoform expression and phosphorylation in the left ventricle of 4-month-old wild-type (WT) and myopalladin knockout (MKO) male mice.


