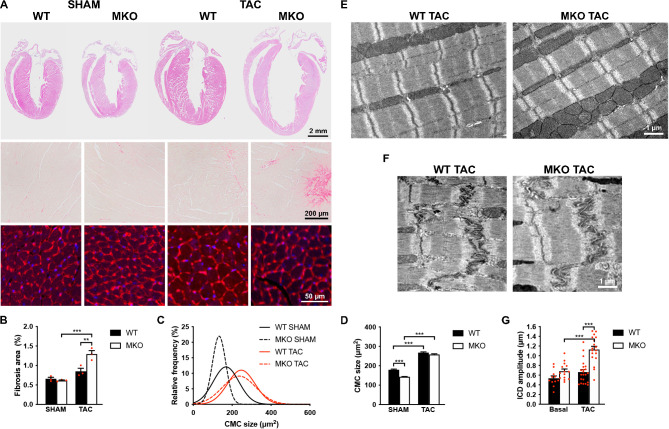
Figure 5. Histological and transmission electron microscopy analyses of hearts from wild-type (WT) and myopalladin knockout (MKO) male mice 4 weeks after transaortic constriction (TAC) or SHAM.
(A) Top, Hematoxylin and eosin (H&E) stainings of hearts from WT and MKO mice subjected to TAC or SHAM. Middle, Representative Picro Sirius Red stainings of the left ventricle, showing fibrosis in MKO mice after TAC. Bottom, Representative wheat germ agglutinin (WGA) stainings of the left ventricle (red). Nuclei are visualized by DAPI (blue). (B) Percent area of interstitial fibrosis in the left ventricle. Data are represented as mean ± standard error of the mean (SEM) (n = 3 per group). **p < 0.01; ***p < 0.001; two-way analysis of variance (ANOVA) with Bonferroni’s multiple comparison test. (C) Gaussian distribution curves from histograms of cardiomyocyte (CMC) size in the left ventricle of WT and MKO mice subjected to TAC or SHAM (n = 333 CMCs from three WT mice and 809 CMCs from three MKO mice subjected to SHAM; 423 CMCs from three WT mice and 665 CMCs from three MKO mice subjected to TAC). (D) Average CMC size in WT and MKO mice subjected to TAC or SHAM. Data are represented as mean ± SEM. **p < 0.01; ***p < 0.001; two-way ANOVA with Bonferroni’s multiple comparison test. (E–F) Electron micrographs of papillary muscle from WT and MKO mice 4 weeks after TAC, showing sarcomere (E) and intercalated disc (ICD) (F) structure. (G) Average ICD fold amplitude in WT and MKO mice. Data are represented as mean ± SEM (n = 11 ICDs from WT mice and n = 14 ICDs from MKO mice, n = 22 ICDs from WT mice, and n = 18 ICDs from MKO mice subjected to TAC). ***p < 0.001; two-way ANOVA with Bonferroni’s multiple comparison test.

