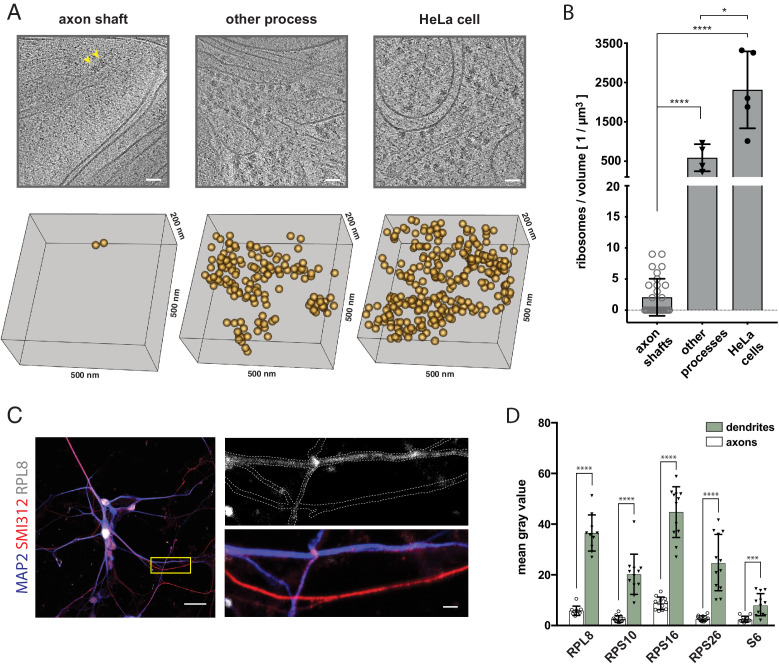
Figure 4. The shaft of the growing axon is scarcely populated by ribosomes.
(A) Examples of ribosomes observed in cryo-tomograms of axon shafts from ALI-COs, of other cellular processes from ALI-COs, and of HeLa cells. The bottom panel shows 0.05 µm3 cryo-ET volumes, corresponding to the area shown in the upper panel. Positions of all ribosome-like particles observed in that volume are shown as orange spheres. (B) Comparison of the numbers of ribosome-like particles, normalized to the tomographic volume, observed in axon shafts, other processes and HeLa cells. Individual data points represent individual cryo-tomograms (30, 4, and 5 tomograms, respectively). Mann-Whitney tests were employed for statistical analysis: p < 0.0001 (****); p < 0.05(*). (C) Immunofluorescence images of dissociated neurons from organoids reveal low signal for the ribosomal 60 S component RPL8 in axon processes (identified by SMI312+/MAP2- labeling) in comparison to dendrites (identified by SMI312-/MAP2+ labeling). The yellow box outlines the area magnified in the right panel. The top image of the right panel shows the immunofluorescence signal for the ribosomal subunit RPL8. The bottom image shows the SMI312/MAP2/RPL8 composite. The white dashed line depicts the outline of axons and dendrites and was traced based on the MAP2 and SMI312 signal. The image shown is representative of the data used for quantifications shown in D. (D) Quantification of immunofluorescence images of ALI-CO derived dissociated neurons labeled for five distinct ribosomal proteins. The bars report the mean pixel grey value along axons and dendrites (mean ± SD). Each data point represents a different axon or dendrite. With the exception of quantifications done on the ribosomal protein S6, axons were identified as SMI312+/MAP2- neuronal processes, while dendrites were identified as SMI312-/MAP2+ neuronal processes. Due to antibody incompatibility, in the case of S6, dendrites were identified as MAP2+ processes while axons were identified as GFP+/MAP2- processes. The data pertains to one biological replicate. Mann-Whitney tests were employed for statistical analysis: RPL8, N = 10, p < 0.0001 (****); RPS10, N = 12, p < 0.0001 (****); RPS16, N = 12, p < 0.0001 (****); RPS26, N = 12, p < 0.0001 (****); S6, N = 12, p = 0.0001 (***). Scale bars: 50 nm in A., 20 µm and 2 µm in C.


