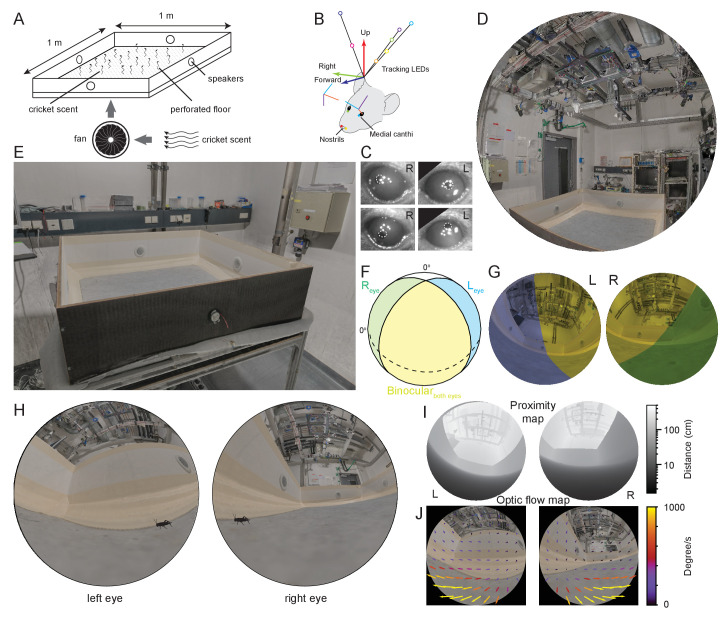
Figure 1. Reconstruction of experimental arena and surrounds from the animal’s perspective.
(A) Schematic of experimental arena with olfactory and auditory noise. (B) Schematic of tracking, anatomical and eye camera calibration. Head position and orientation was tracked using seven IR-LEDs (colored circles). Nostrils (red, yellow filled circles), left (blue filled circle), and right (green filled circle) medial canthi were identified and triangulated in calibration images and used to define a common coordinate system (forward, blue arrow, right, green arrow, and up, red arrow), into which the calibrated eye camera location and orientation could also be placed (eye camera vertical, cyan, horizontal, purple, camera optical axis, red). (C) Example left- and right eye camera images with tracked pupil position (white dashed outlines). (D) Rendered digital reconstruction of the laboratory room and (E) experimental arena. (F) Schematic representation of mouse’s left- (blue) and right (green) visual fields, showing also the region of binocular overlap (yellow) and un-seen region (white). (G) Reconstruction of the arena and room from the animal’s left- and right eye perspective, with monocular and binocular regions colored as in (F). (H) Reconstruction of the animal’s view of the prey (cricket - black) in the experiment arena. (I) Representation of left and right eye views of the arena and surrounding objects grayscale-coded by distance from the eye. (J) Rendered animal’s eye views from the left- and right eyes with overlay of arrows representing optic flow during 10 ms of free motion.


