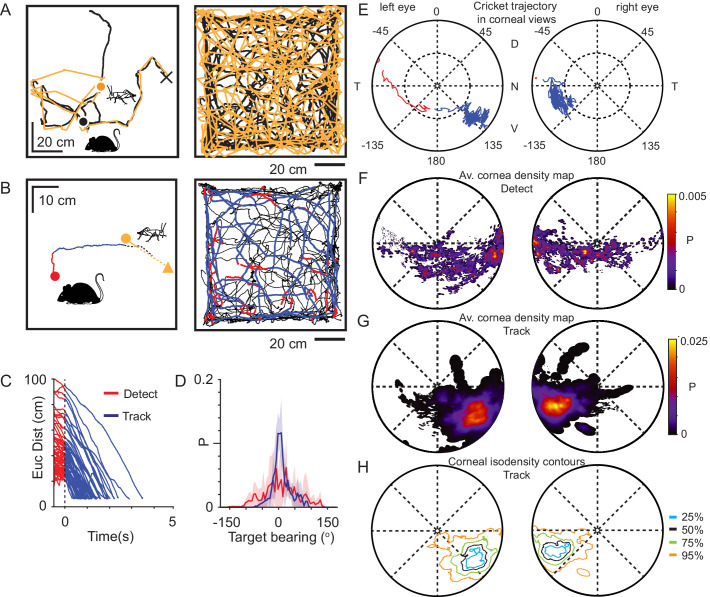
Figure 2. Mice use a focal region of their visual field to track prey.
(A) Mouse (black) and cricket (orange) paths during a single pursuit sequence (left), and for all pursuit sequences in one session for one animal (right). Pursuit start denoted as filled circles and cricket capture as X. (B) Mouse (red and blue) and cricket (orange) paths during an individual pursuit sequence (left) and all pursuit sequences in one session from one animal (right), showing detect (red) and track (blue) epochs of the mouse path. Paths after a cricket escape shown dashed. Pursuit sequence start shown as filled circles, cricket landing point after a jump shown as a filled triangle. (C) Euclidean distance between mouse and cricket during detect (red) and track (blue) epochs (n=65 trajectories, n=3 mice). (D) Mean and SD bearing to cricket (angle between mouse’s forward direction and cricket location) during detect (red), and track (blue) epochs from all animals (detect: 57 epochs; track: 65 epochs, n=3 animals, bin size = 5°). (E) Trajectory of the projected cricket position in the left and right corneal views, during a single pursuit sequence. Color scheme as for D. The inner dashed circle is 45° from the optical axes. Dorsal (D), ventral (V), nasal (N), and temporal (T) directions indicated. (F) Average probability density maps for detect epochs (4628 frames from three animals). Orientation as in E. (G) Average probability density maps for track epochs (13641 frames from three animals). Orientation as in E. (H) Isodensity contours calculated from the average probability density maps for track epochs. (note that 50% means that this region contains 50% of the total density, and likewise for the other contours). Orientation as in E.


