
Figure 3. Functional foci are not sampled by the highest density retinal ganglion cell region.
(A) Schematic of mouse eye model (left upper) with profile of all refractive indices (RI, left lower). Reconstructions of the optic disc (black), highest (>8000 cells/mm2, beige) and second highest (>7000 cells/mm2, brown) retinal ganglion cell (RGC) density regions redrawn from Dräger and Olsen, 1981, shown in lower right. (B) Position in corneal views of the high RGC density regions (brown and beige filled regions), and isodensity contours from Figure 2H after projection through the eye model. Orientation as in Figure 2E. (C) Horizontal axis histograms for the nasal half of the corneal view of the second highest RGC region (brown) and 50% isodensity contour for left (blue) and right (green) eyes. (D) Top-down view of the coverage regions for the right eye of the 50% isodensity contour (green, N = 7551 frames) and second highest RGC region (brown, N = 51007 frames) for a single animal. Bars represent the probability density function for the respective regions at that azimuth angle. (E) Position in corneal views of Alpha-ON sustained RGC densities (redrawn from Bleckert et al., 2014) after projection through the eye model. Colored regions show the 95% (dark purple), 75% (medium purple), and 50% (light purple) contour regions of the peak Alpha-ON sustained RGC density. Isodensity contours from Figure 2H. (F) Top-down view of the coverage regions for the right eye of the 95% (dark purple), 75% (medium purple), and 50% (light purple) Alpha-ON sustained RGC contour regions (same as in E, N = 51007 frames) and the 50% isodensity contour from D (green) for a single animal. For the Alpha-ON sustained RGC contour regions, 50% means that this region contains all points which are at least 50% of the peak RGC density.
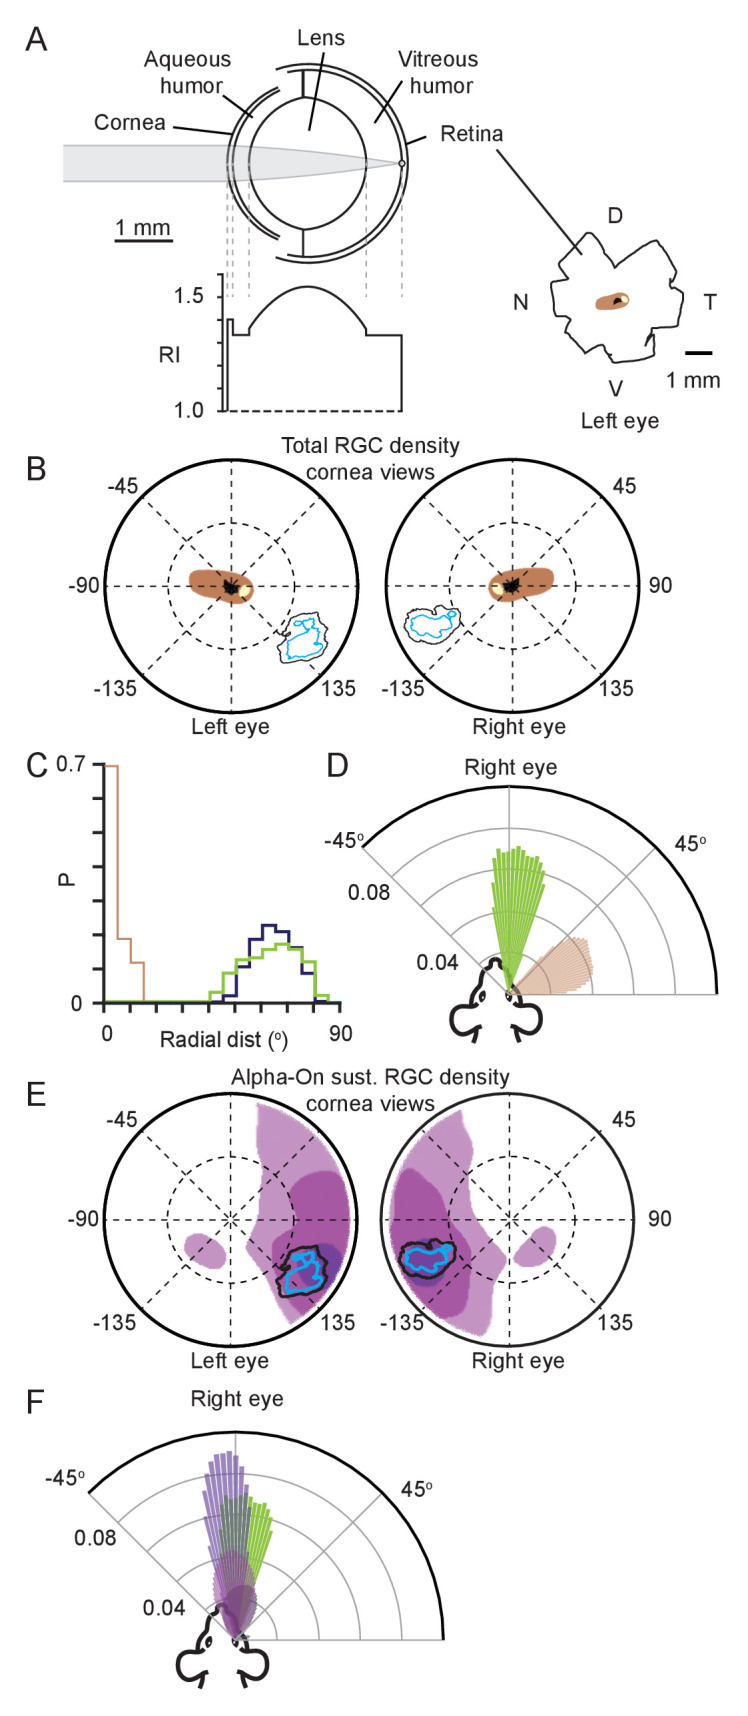
Figure 3—figure supplement 1. Projecting high retinal ganglion cell density region from retina to cornea.
