. 2021 Oct 26;10:e72674. doi: 10.7554/eLife.72674

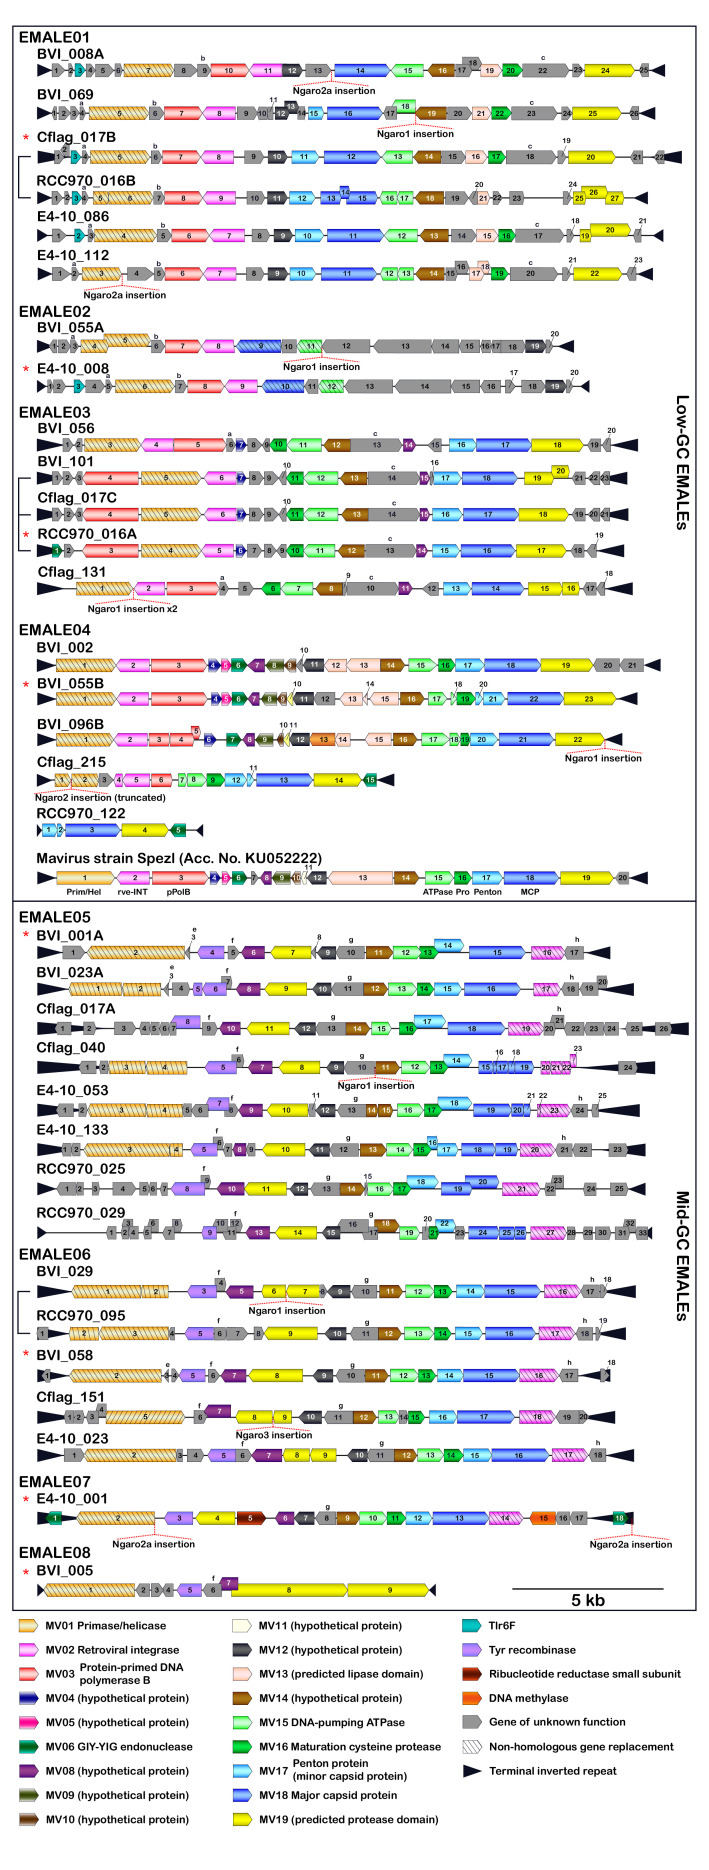
Figure 3. Genome organization of eight EMALE types found in Cafeteria burkhardae.

Shown are schematic genome diagrams of the EMALE type species 1–8; for all 33 complete EMALEs, see Figure 3—figure supplement 1. The reference mavirus genome with genes MV01-MV20 is included for comparison. Homologous genes are colored identically; genes sharing functional predictions but lacking sequence similarity to the mavirus homolog are hatched. Open reading frames are numbered individually for each element. Ngaro retrotransposon insertion sites are indicated where present. The dotted line between EMALE01 and EMALE02 separates a homologous region (left) from unrelated DNA sequences (right) and thus indicates the location of a probable recombination event.

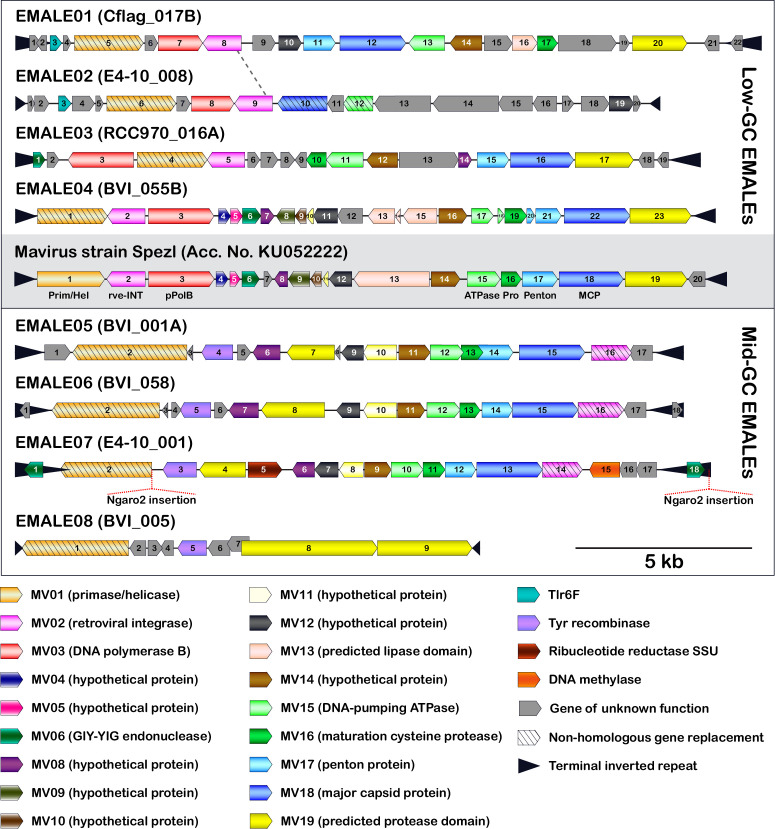
Figure 3.

Figure 3—figure supplement 1. Coding capacity of 33 completely assembled EMALEs in Cafeteria burkhardae.

Figure 3—figure supplement 1.

Shown are genome diagrams for 33 EMALEs in four C. burkhardae strains (BVI, Cflag, E4-10, RCC970).The reference mavirus genome with genes MV01-MV20 is included for comparison. EMALE identifiers consist of host strain name, followed by contig number and sometimes letters to distinguish between several EMALEs on the same contig. Directional boxes indicate open reading frames (ORFs) in the respective orientation. Homologous genes that are present in mavirus or have a predicted function are shown in color. Other homologous ORFs are denoted by lowercase letters. Black triangles represent terminal inverted repeats (TIRs). Brackets indicate EMALEs with homologous integration sites in different host strains. Ngaro retrotransposon insertions are shown when present. Asterisks denote type elements as shown in Figure 3.
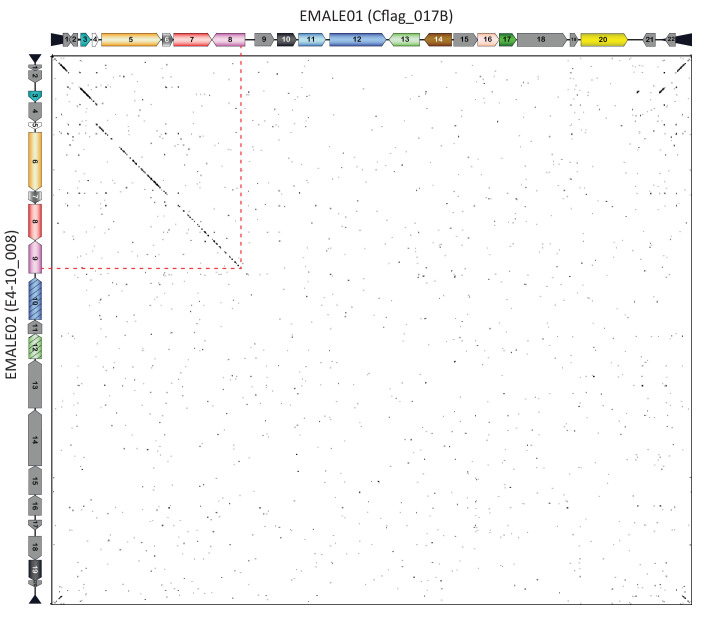
Figure 3—figure supplement 2. Partial synteny between EMALE01 and EMALE02.

Figure 3—figure supplement 2.

DNA dot plot analysis of EMALE01 Cflag_017B and EMALE02 E4-10_008 showing predicted genes along the axes. The synteny ends within the rve-family integrase (rve-INT) gene, which represents the presumed recombination site (red dotted line). For the open reading frame (ORF) color legend, see Figure 3 and Figure 3—figure supplement 1.
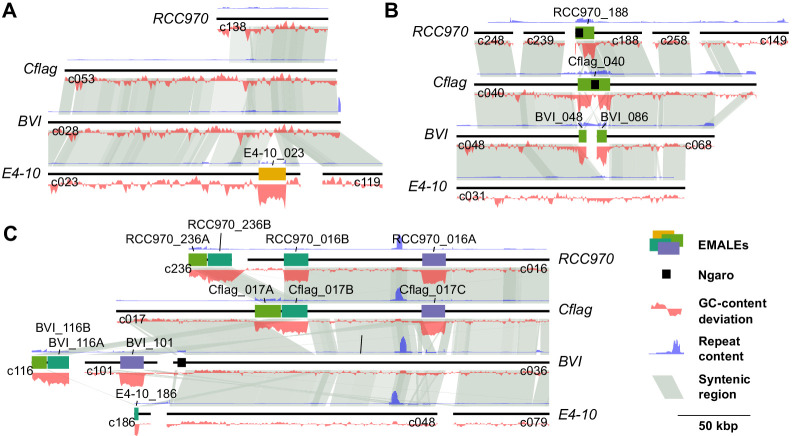
Figure 3—figure supplement 3. Unique and orthologous EMALE integration loci among four Cafeteria strains.

Figure 3—figure supplement 3.

Synteny plots of three genomic loci illustrate different scenarios of EMALE conservation in Cafeteria burkhardae. Homologous DNA regions are connected by gray shadings. Peaks in the blue curve indicate repetitive regions, red curves represent GC-content. (A) EMALE E4-10_023 represents a unique integration site in host strain E4-10. Syntenic regions in other host strains are well resolved and devoid of EMALEs. (B) Homologs of EMALE Cflag_040 are found in orthologous loci in host strains RCC970 and BVI. The Ngaro retrotransposon in this EMALE apparently caused assembly problems, resulting in premature termination of RCC970 contig 188 and splitting the EMALE onto two contigs in BVI. (C) Comparative analysis of the three EMALEs on Cflag contig 17 reveals a complex situation. The double EMALE Cflag_017 A/B has homologs in BVI and RCC970, albeit as partial elements on short contigs. Most of RCC970 contig 16 is syntenic to Cflag contig 17, except for the shorter flanking region of EMALE RCC970_016B, which is likely caused by mis-assembly of the RCC970 contig at the double-EMALE transition. In the BVI assembly, the flanking regions of EMALE Cflag_017 C are present twice, on the EMALE-containing contig 101 and on the EMALE-free contig 36, suggesting a heterozygous condition in BVI.
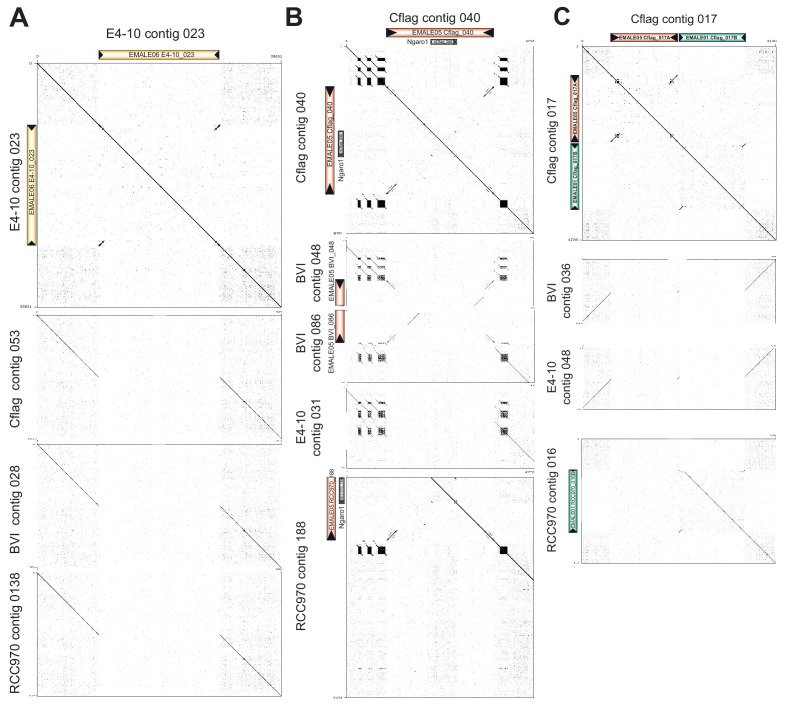
Figure 3—figure supplement 4. DNA dot plots of selected EMALE loci as shown in Figure 3—figure supplement 3.

Figure 3—figure supplement 4.

Shown are DNA dot plots of EMALE(s) including 10 kb of flanking host DNA versus itself and versus syntenic regions in other host strains. Black triangles represent EMALE terminal inverted repeats (TIRs). (A) EMALE E4-10_023 is integrated in non-repetitive host DNA and represents a unique insertion in strain E4-10, with EMALE-free loci in the other three strains. (B) EMALE Cflag_040 is integrated in a cluster of complex host repeats and has homologous integration sites in strains BVI and RCC970. (C) The double EMALE Cflag_017 A/B likely caused mis-assembly in strain RCC970.
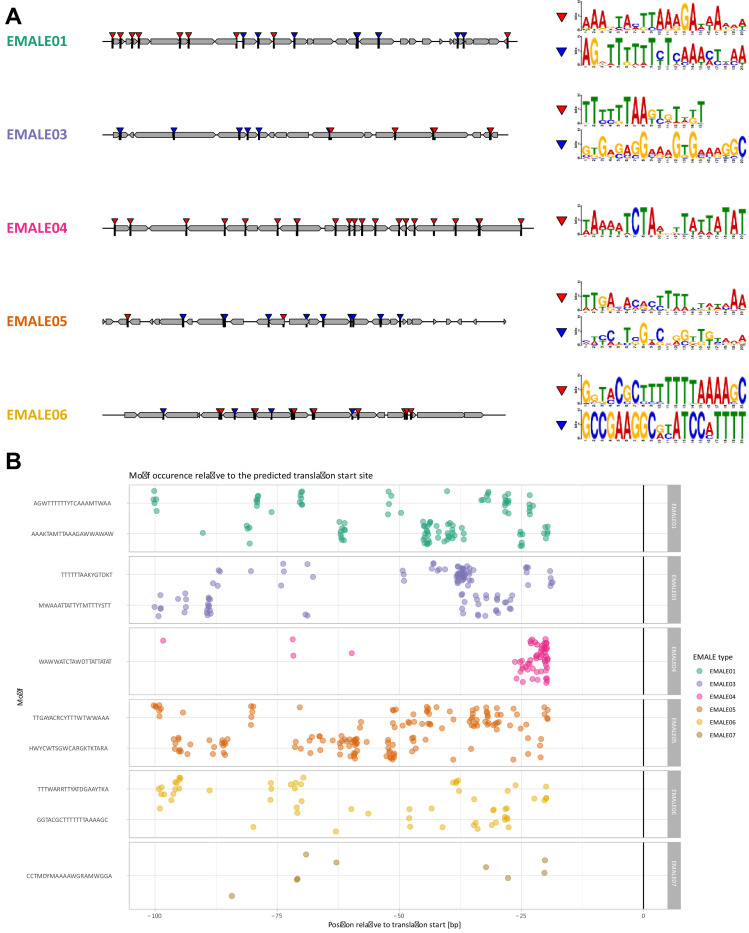
Figure 3—figure supplement 5. Putative promoter motifs in EMALE genomes.

Figure 3—figure supplement 5.

(A) Sequence logos of high-scoring motifs predicted with MEME in immediate upstream regions of coding sequences and their positions in EMALE genomes. Character height at each position of a sequence logo corresponds to the frequency of the respective nucleotide at that position. (B) EMALE promoter motif occurrences relative to predicted translation start sites. Each dot corresponds to the start of a predicted promoter motif plotted relative to the ATG start codon of the downstream gene. Motifs are grouped by the EMALE type in which they were initially predicted.
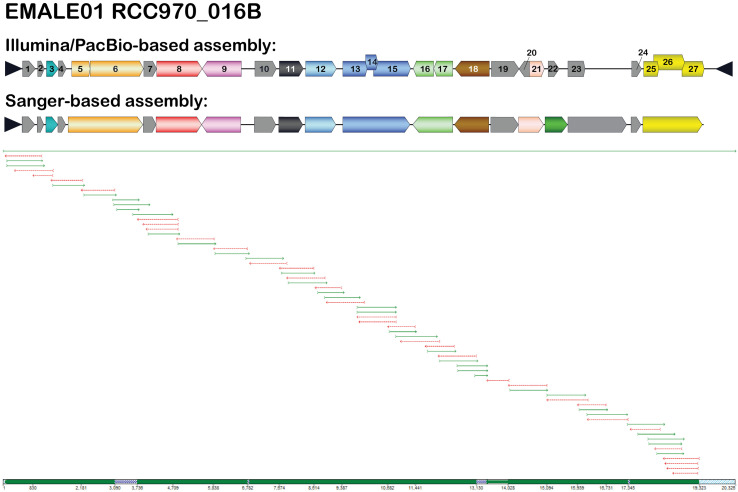
Figure 3—figure supplement 6. Correction of Illumina/PacBio-based assemblies by PCR and Sanger sequencing.

Figure 3—figure supplement 6.

EMALE01 RCC970_016B was re-evaluated by PCR analysis and subsequent Sanger sequencing of PCR products. The resulting assembly is compared to the Illumina/PacBio-based assembly (top). The bottom part of the figure shows a Sequencher screenshot of the assembled Sanger reads. The long green arrow represents the Illumina/PacBio sequence, the shorter green and red arrows represent individual Sanger reads.