. 2021 Oct 26;10:e72674. doi: 10.7554/eLife.72674

Figure 5. Ngaro retrotransposons in Cafeteria burkhardae.

(A) Genomic profile of an EMALE-integrated Ngaro element showing a GC-content graph (top), open reading frame (ORF) organization of EMALE and Ngaro (middle), and a schematic overview of the three genomic entities (bottom; host: gray, EMALE: blue, Ngaro: red). (B) Self-versus-self DNA dot plot of 80 concatenated Ngaro sequences. Block patterns define Ngaro types 1–4. Ngaros are numbered according to Supplementary file 1, with red numbers indicating retrotransposons inserted in EMALEs. (C) Distribution of Ngaro integration loci in EMALE and host DNA. Ngaro types 1 and 2a show a clear preference for EMALE loci, in contrast to Ngaro types 2b, 3, and 4 that are mostly found in host loci. (D) Coding potential of C. burkhardae Ngaro retrotransposons, shown for one example per type with their host strain and contig numbers listed. Triangles indicate direct repeats. GAG, group specific antigen; RT, reverse transcriptase; RH, ribonuclease H; YR, tyrosine recombinase.

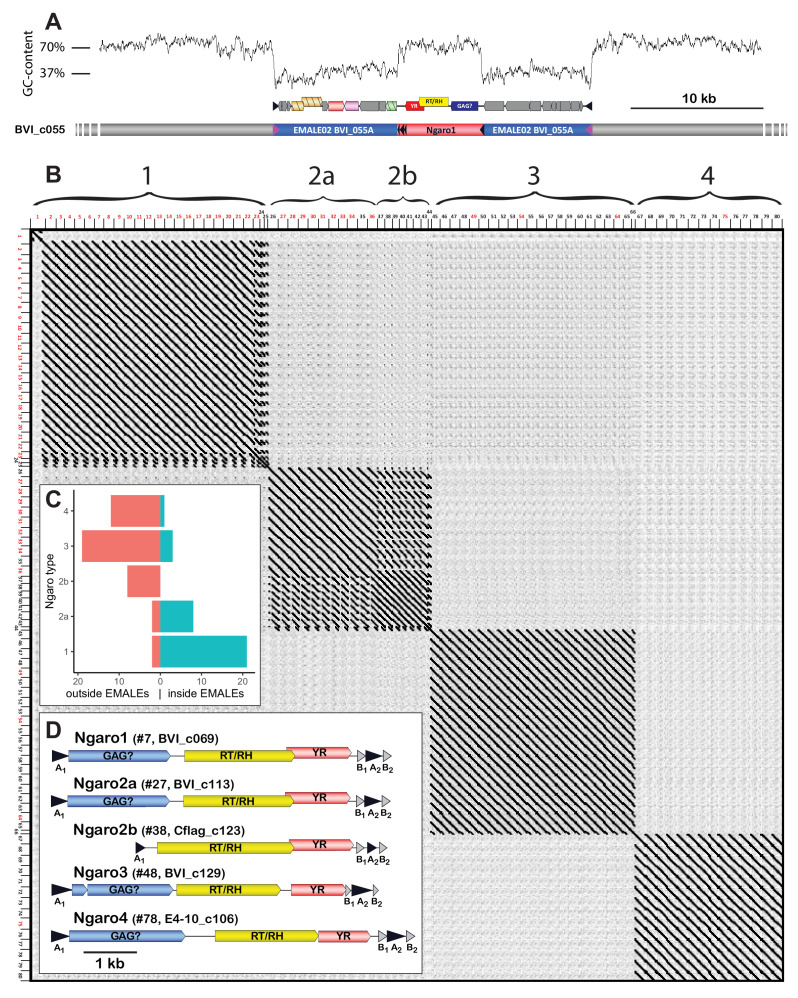
Figure 5.

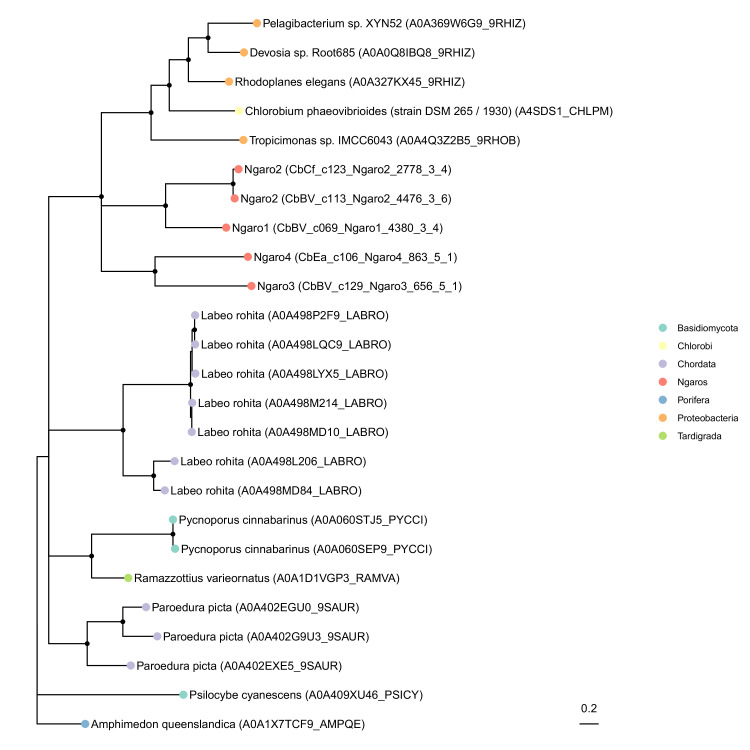
Figure 5—figure supplement 1. Phylogenetic placement of Ngaro tyrosine recombinases.

Figure 5—figure supplement 1.

Shown is an unrooted maximum likelihood phylogenetic tree of tyrosine recombinases comparing Cafeteria Ngaro-encoded proteins (red dots) with their most similar sequences in UniProt (color-coded at the phylum level). Nodes with <50% bootstrap support were collapsed; nodes with >80% bootstrap support are marked by black dots. The distribution across a very broad range of phyla (fish, fungi, sponges, tardigrades, and bacteria) indicates that this integrase is likely associated with highly mobile transposons that have broad host ranges, confirming previous studies on these elements (Poulter and Goodwin, 2005).
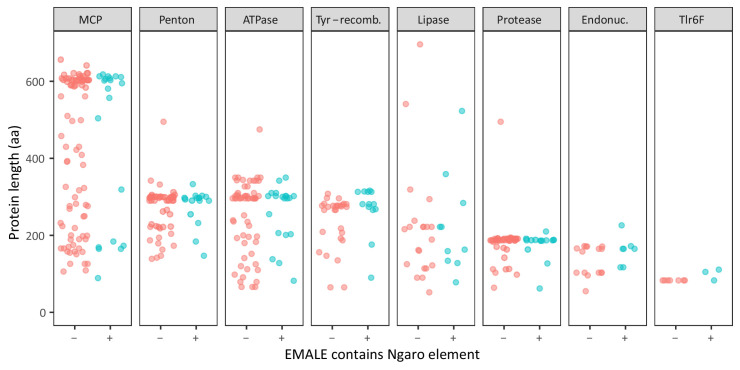
Figure 5—figure supplement 2. Protein length distributions in EMALEs with and without retrotransposons.

Figure 5—figure supplement 2.

Integration of Ngaro retrotransposons might lead to the inactivation of EMALEs, thereby promoting their degeneration and the pseudogenization of their genes. To test this hypothesis, we compared the predicted protein lengths for conserved genes in EMALEs without (red) and with transposons (blue). Gene length here serves as a proxy for pseudogenization because this process leads to the emergence of premature stop codons and frameshifts, which in turn leads to shorter annotated genes.
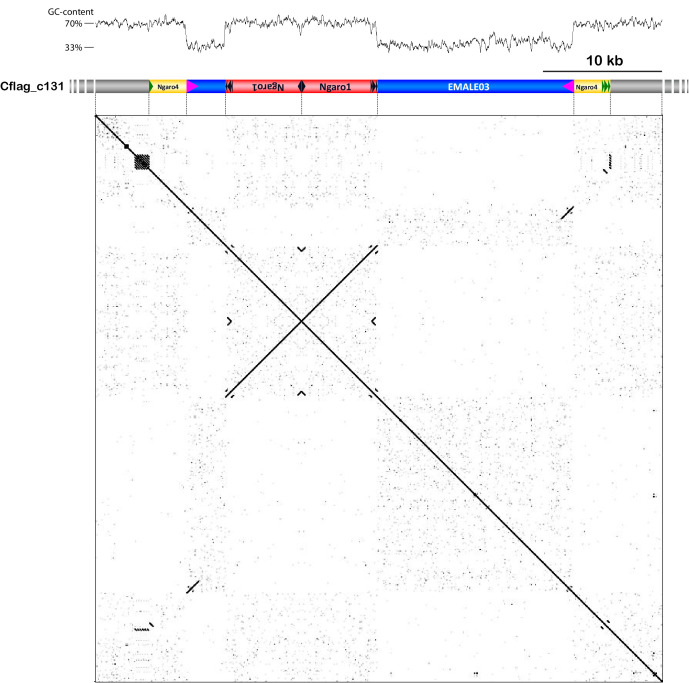
Figure 5—figure supplement 3. Nested integration scenario involving one EMALE and three Ngaro retrotransposons.

Figure 5—figure supplement 3.

EMALE03 Cflag_131 (blue) is inserted into a type 4 Ngaro retrotransposon (yellow) and contains two insertions of type 1 Ngaros (red). The nested integration scenario is depicted by a GC-content graph (top), a graphic representation of the respective genomic region on contig 131 of Cafeteria burkhardae strain Cflag (middle), and a self-versus-self DNA dot plot (bottom). Host sequence is shown in gray; terminal repeats are represented by colored triangles.