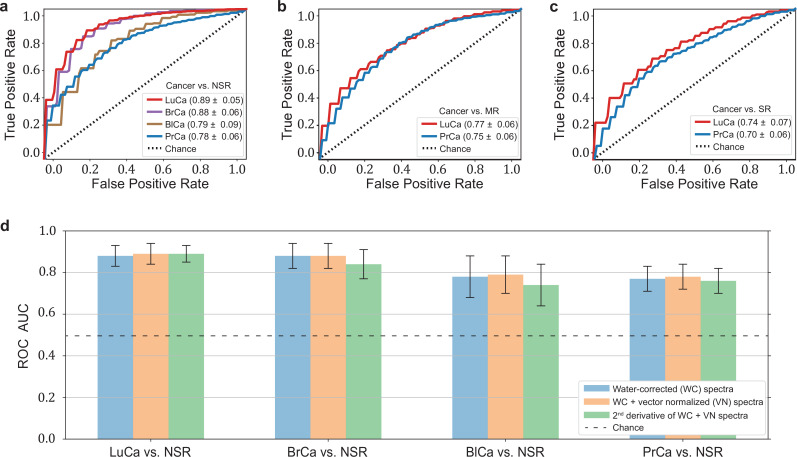
Figure 2. Diagnostic performance of lung, prostate, bladder, and breast cancer detection based on infrared molecular fingerprints (IMFs) of blood sera.
Receiver operating characteristic (ROC) curves for the binary classification of the test set with support vector machine (SVM) models trained on water-corrected and vector-normalized IMFs. The different cancer entities were tested against (a) non-symptomatic references, (b) mixed references that also include organ-specific symptomatic references, and (c) organ-specific symptomatic references only. Detailed cohort characteristics can be found in Figure 2—source data 1. (d) Area under the receiver operating characteristic curve (AUC) for the test sets according to different spectral pre-processing of the IMFs. The error bars show the standard deviation of the individual results of the cross-validation (LuCa: lung cancer; PrCa: prostate cancer; BrCa: breast cancer; BlCa: bladder cancer; NSR: non-symptomatic references; MR: mixed references; SR: symptomatic references).


