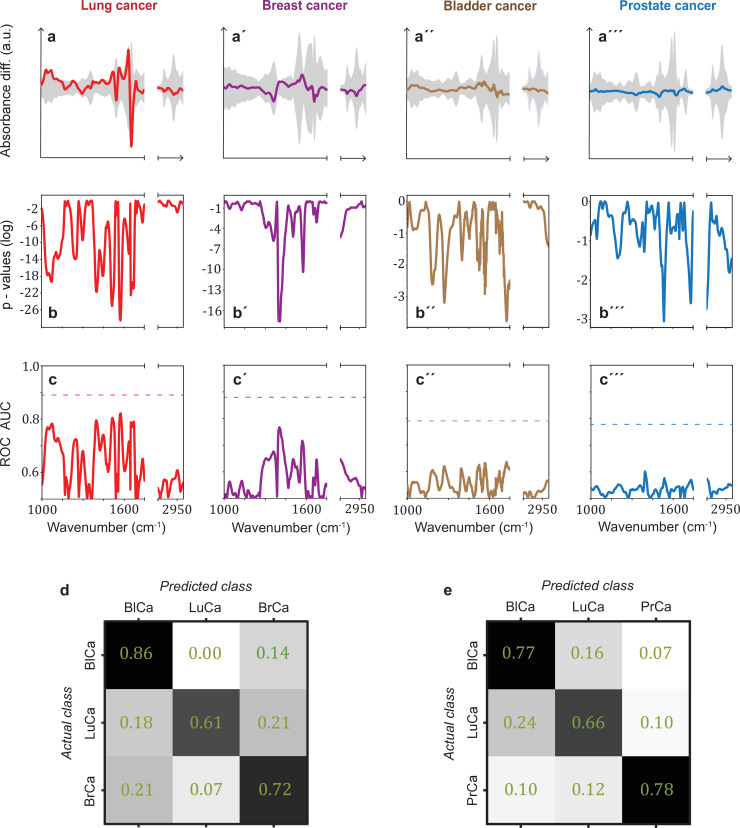
Figure 3. Infrared spectral signatures of lung, prostate, bladder, and breast cancer.
(a-a''') Differential fingerprints (standard deviations of the reference cohorts are displayed as grey areas), (b-b''') two-tailed p-value of Student’s t-test, and (c-c''') area under the receiver operating characteristic curve (AUC) per wavenumber (extracted by application of Mann–Whitney U test) compared to the AUC of the combined model (dashed horizontal lines). Confusion matrix summarizing the per-class accuracies of multiclass classification of (d) lung, bladder, and breast cancer (matched female cohort) with overall model accuracy of 0.73 ± 0.11, and (e) lung, bladder, and prostate cancer (matched male cohort) with overall model accuracy of 0.74 ± 0.13. Detailed cohort characteristics can be found in Figure 3—source data 1. Chance level for the three-class classification corresponds to 0.33 (LuCa: lung cancer; PrCa: prostate cancer; BrCa: breast cancer; BlCa: bladder cancer).


