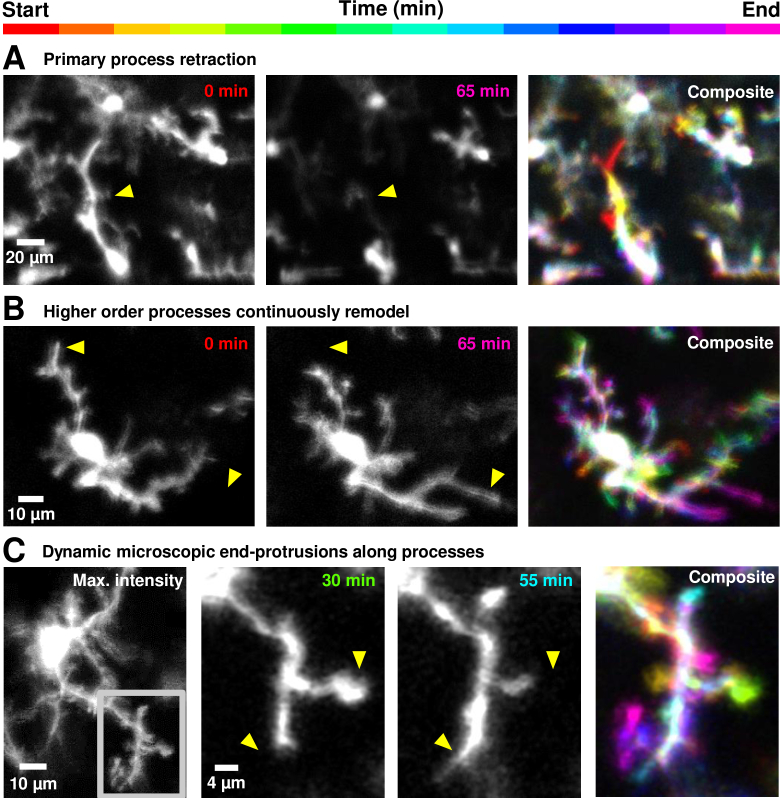
Fig. 3.
Heterogeneity in process motility in healthy retinal microglial cells of the living mouse, from primary to tertiary end-processes. A) Rare primary process retraction observed in a microglial cell (all timepoints shown in Visualization 2 (26MB, avi) ). Yellow arrow-heads mark the same retinal landmarks. B) In another cell, secondary and tertiary processes remodel (Visualization 3 (24MB, avi) ). In Fig. 5 and Fig. 6, these observations of motility are quantified at the microscopic process level, using spatio-temporal image analysis. C) Left: Stable imaging of a single microglial cell over 1.6 hours (95 minutes) (further explored in Fig. 8), with maximum intensity projection computed over the imaging time-course. Gray inset shows a single branch of the cell further investigated in subsequent panels to right. High-resolution view of a branch shown in gray inset in first panel, showing motile end-processes, only a few microns long, successfully tracked over 95 minutes (Visualization 5 (37MB, avi) ). Yellow arrow-heads mark the same retinal landmarks.

