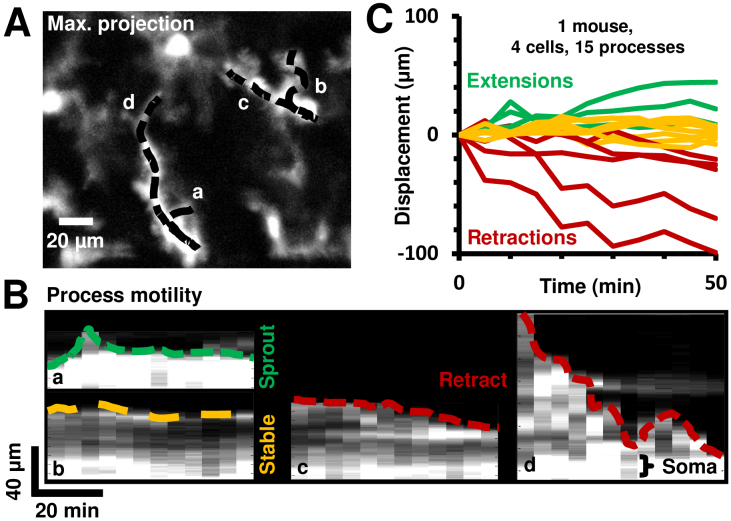
Fig. 5.
Quantification of cell-process motility and speed using space-time image analysis in a representative mouse. A) Maximum projection image of a time-lapse sequence at one AOSLO field. Process paths are traced and overlaid as shown with representative traces a-d. B) Four representative space-time images, each corresponding to a unique cell-process, showing the intensity across a process path as a function of time. The tip of the process is traced in color (green: extension, yellow: stable, red: retraction). C) Similar displacement vs time curves are plotted for all processes analyzed in one mouse.

