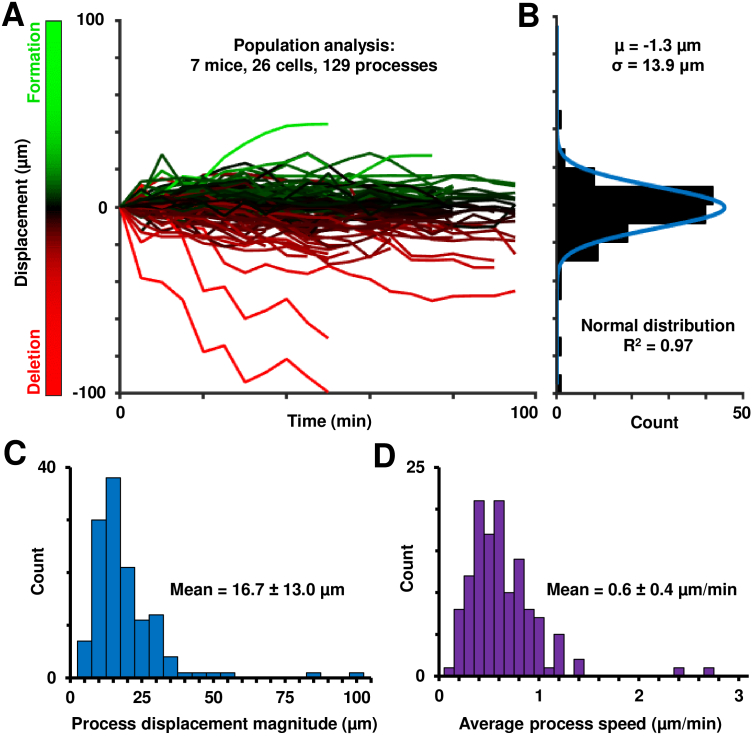
Fig. 6.
Population analysis of in vivo retinal microglial process motility. A) Space-time plots (displacement vs time) plots of 129 processes across 7 mice, with extensions-to-retractions shown in a green-red colormap. B) Histogram of net-displacements of these processes, showing overall balanced extensions and retractions of microglial processes across a population. Blue fit is a normal distribution. C) Histogram of maximum displacement magnitude per process, as defined in the Methods section 2.8. D) Histogram of the average microglial process speeds of 129 processes across the population studied.

