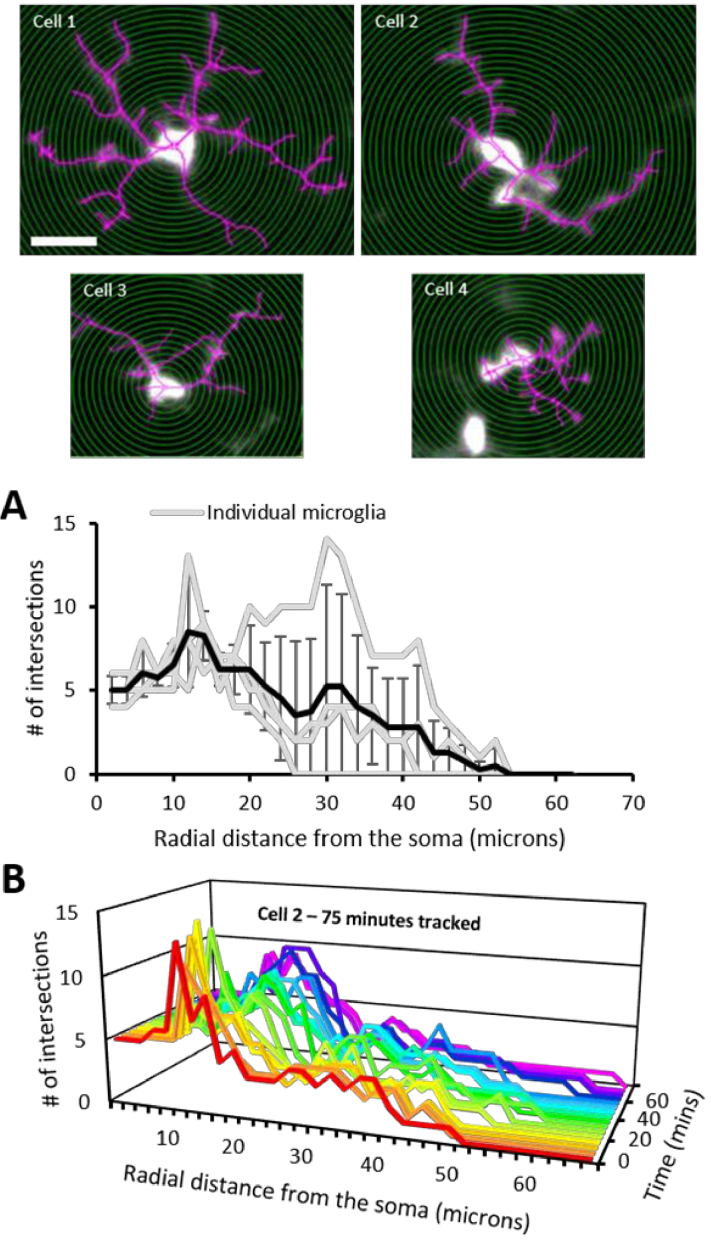
Fig. 7.
Sholl analysis for assessing microglial complexity and dynamics. Top: Fluorescent AOSLO images (cells 1-4) used for Sholl analysis (scalebar = 20 µm). Concentric 2 µm radii (green) and process tracings (magenta) are overlayed. A. The number (#) of intersections for each cell (gray) plotted for every consecutive 2 µm distance from the center of the soma. Black line represents the mean ±1 SD. B. The number (#) of intersections vs. radial distance from the soma tracked in cell #2 for 75 minutes (5-minute intervals). Also see Visualization 8 (5.2MB, avi) for a time-lapse video of the fluorescence data and the corresponding cell tracings which enabled this time-varying Sholl analysis.

