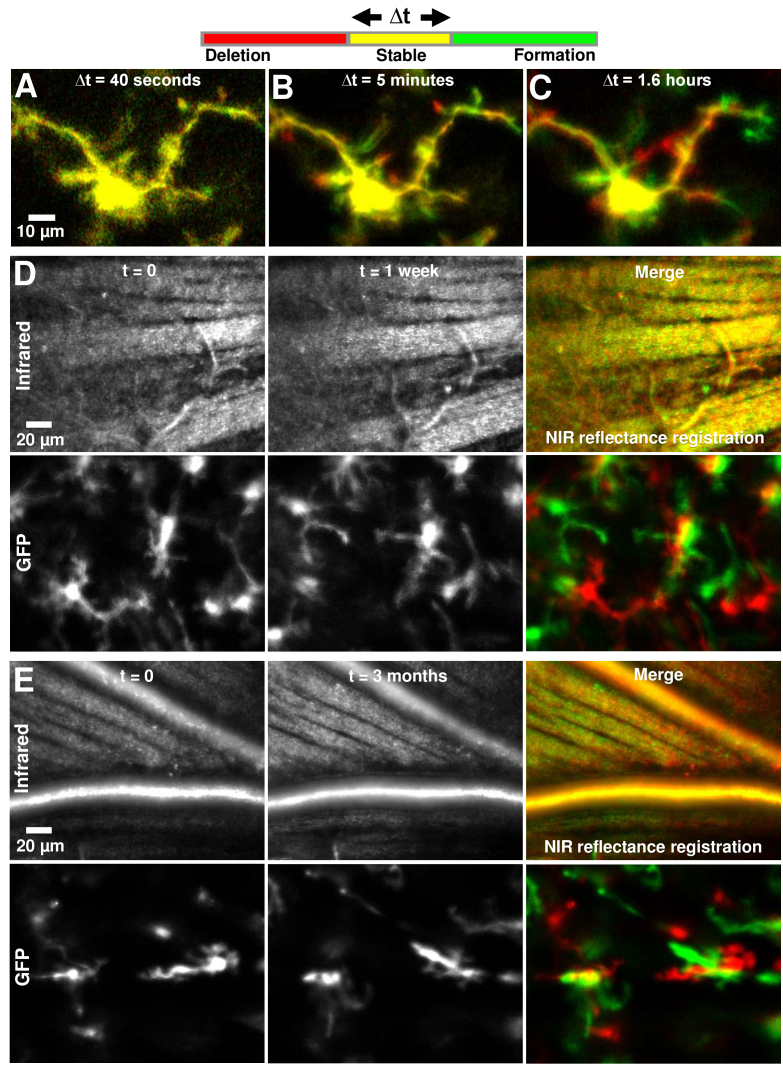
Fig. 8.
Imaging single-cell dynamics of microglia, from seconds to months. Each image is a red-green merge of two timepoints at the same imaging location, with imaging interval given by Δt. Thus, parts of the cell/image that don’t move in a certain interval appear yellow. A-C) Δt=40 seconds, 5 minutes and 1.6 hours (95 minutes) respectively. The same cell is tracked, in the same imaging session. A ‘zoom-in’ of the top-right branch of this cell is shown in Visualization 5 (37MB, avi) and Fig. 3(C). D-E) Δt=1 week and 3 months respectively. In each case, the EGFP fluorescence channel is shown on the bottom panel while the near-infrared reflectance channel is shown on the top. The reflectance channel provided precise registration of imaging location.

