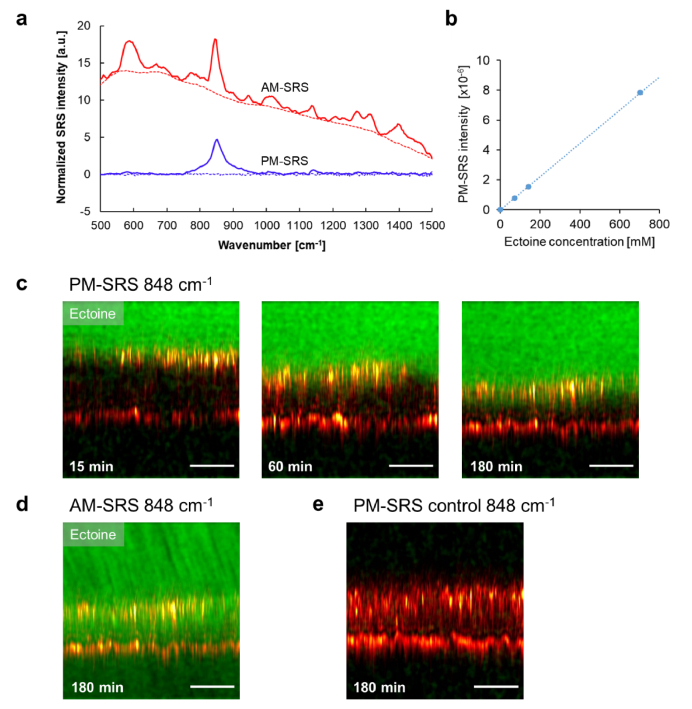
Fig. 2.
SRS images of a skin moisturizing agent: (a) AM- and PM-SRS spectra of 10% ectoine solution (solid lines) and pure water (dashed lines). (b) PM-SRS versus ectoine concentration. (c-e) XZ depth images showing SRS signal intensity at 848 cm-1 (green) overlaid with the confocal-reflection signal (red hot) at different times after applying the ectoine solution: (c) PM-SRS at 15 min, 60 min, and 180 min (See Visualization 1 (9.6MB, avi) ), (d) AM-SRS at 180 min, and (e) PM-SRS control (no ectoine). The scale bar is 50 μm.

