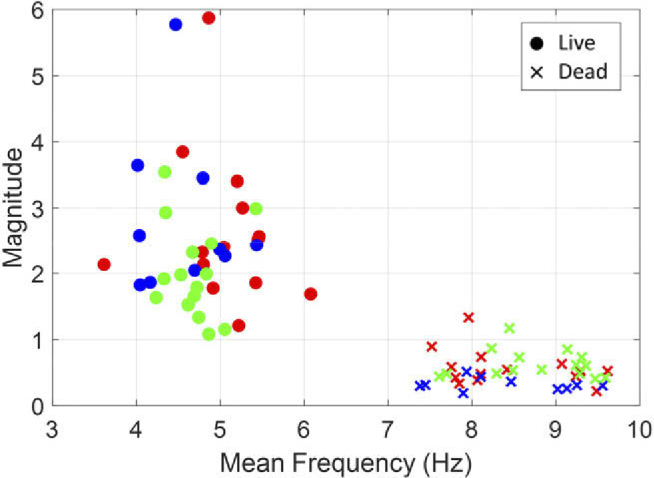
Fig. 5.

Dynamic activities of HeLa cells in three samples were observed for 24 hours using the DFFOCM system, and mean frequency and magnitude of live (t = 0h) and dead (t = 24h) are shown. The three samples are each marked with different colors (red, green, blue).
