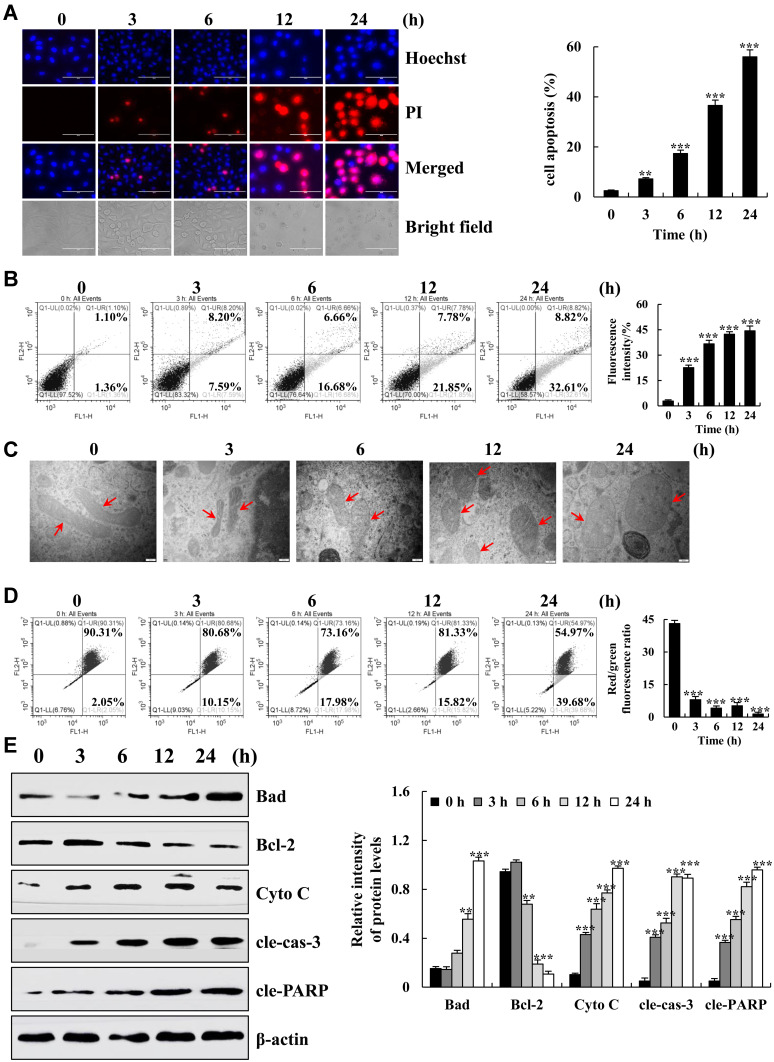
Figure 2.
Apoptotic effects of 18β-Gly on A549 cells. (A) A549 cells were double stained with Hoechst 33342 and PI, and the fluorescence intensities and morphology changes were observed under a fluorescence microscope (original magnification, 200×). (B) Percentage of apoptotic cells was detected by flow cytometry. (C) Mitochondrial morphology was observed by an electron microscope, the morphological changes of mitochondria occurred at the arrow marks. (D) The MMP was detected by FCM. (E) The protein expression levels were measured by Western blotting after treatment of A549 cells with 18β-Gly. The percentage of apoptotic cells represents the means ± SDs. β-actin served as the loading control. **P < 0.01, ***P < 0.001 vs 0 h.

