Figure 4.
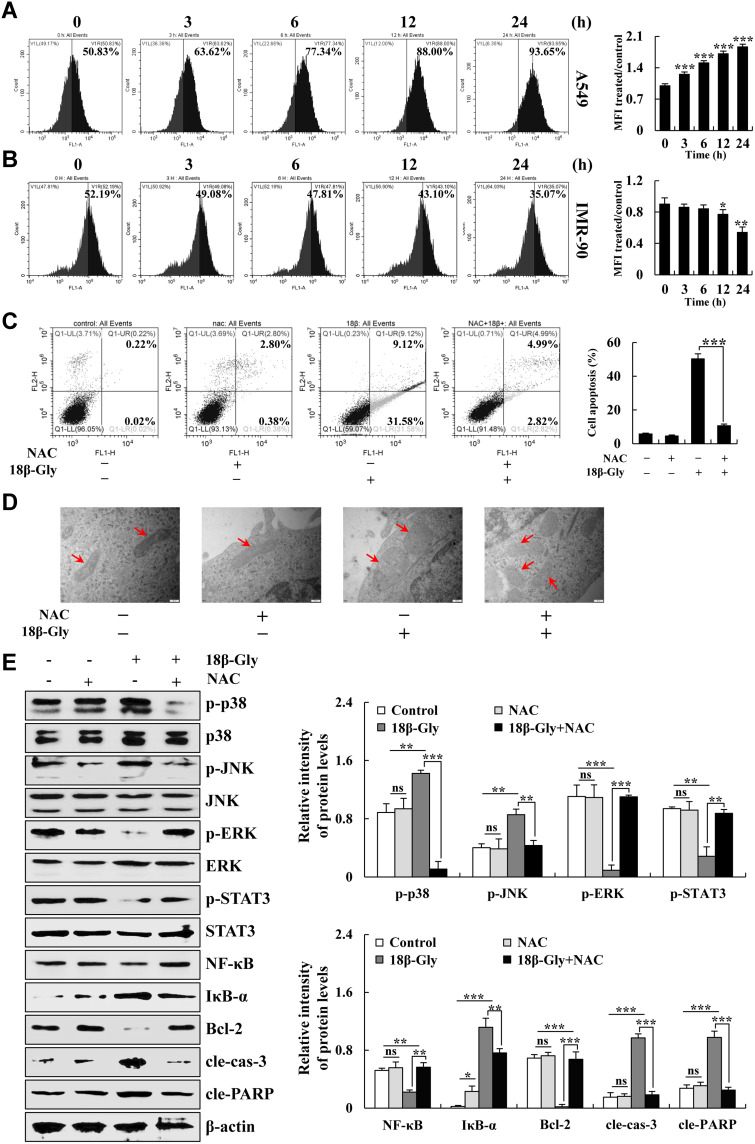
Effects of 18β-Gly on ROS generation and inducing apoptosis of A549 cells. (A) A549 cells were treated with 18β-Gly, and intracellular ROS levels were measured by FCM. (B) IMR-90 normal cells were treated with 18β-Gly, and intracellular ROS levels were measured by FCM. (C) A549 cells were treated with NAC and 18β-Gly. Then the percentage of apoptotic cells was detected by FCM. (D) A549 cells were treated with NAC and 18β-Gly. Next, mitochondrial morphology was observed by a transmission electron microscope, the morphological changes of mitochondria occurred at the arrow marks. (E) A549 cells were treated with 18β-Gly and NAC, after which the expression levels of MAPKs, STAT3, NF-κB, cle-cas-3, and cle-PARP were detected by Western blotting. β-actin was used as the loading control. ns, not significant, *P < 0.05, **P < 0.01, ***P < 0.001 vs 0 h or the NAC + 18β-Gly group.

