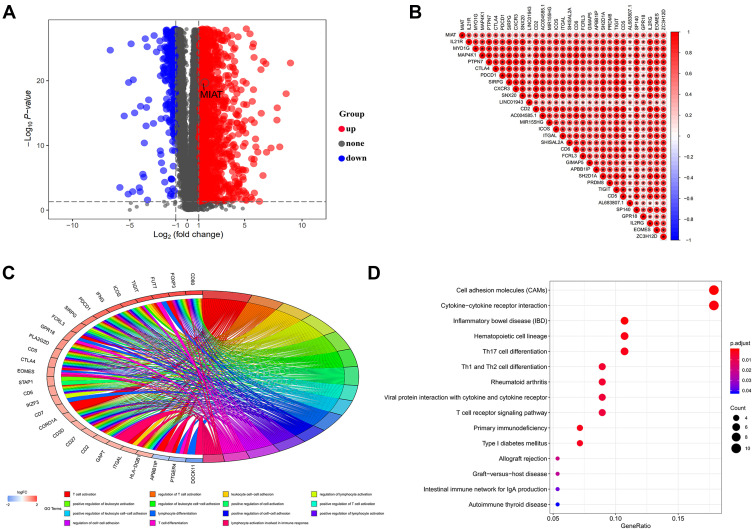
Figure 3.
The function enrichment analysis of MIAT and its co-expression genes in BC. (A) The volcano map for difference analysis was plotted between the normal samples and the tumor samples from TCGA. (B) Correlation analysis between MIAT and the top 30 co-expressed genes, “*”Indicates statistical significance. (C) Top 15 GO-BP terms for MIAT co-expressed genes. (D) Top 15 KEGG pathways enriched by MIAT co-expressed DEGs.

