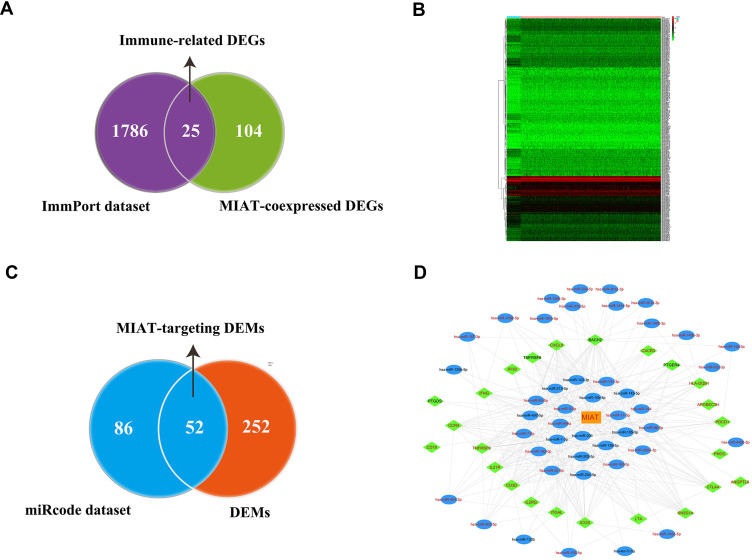
Figure 4.
Reconstruction of MIAT-associated ceRNA network. (A) Screening of candidate immune-related DEGs related to MIAT. (B) Heat map showed distinct miRNA expression profiles of cases belong to normal vs tumor groups. (C) Screening of MIAT-targeting miRNAs between DEMs and miRcode dataset. (D) Construction of MIAT-related and immune-related ceRNA regulatory networks. Orange rectangles indicate lncRNA MIAT, blue ellipses indicate DEMs, green diamond indicate IRGs, red fonts indicate upregulation, black fonts indicate downregulated, edges indicate interactions.

