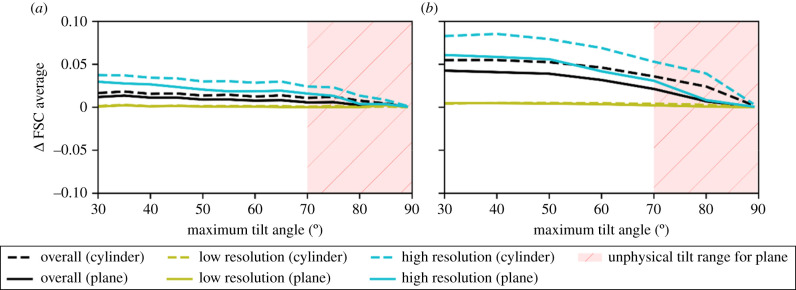
Figure 8.
The difference in FSC average between the fixed number of projections and fixed tilt increment data acquisition schemes as a function of the maximum tilt angle for planar samples (dashed lines) and cylindrical samples (solid lines), for apoferritin (a) and ribosome samples (b). The plots show the overall FSC average and the FSC in high- and low-resolution bins. For the planar samples, high maximum tilt angles are considered to be unphysical due to sample and mechanical limitations and are shaded in red. In each case, the data acquisition scheme with a fixed number of images shows better reconstruction quality than the scheme with a fixed tilt increment.

