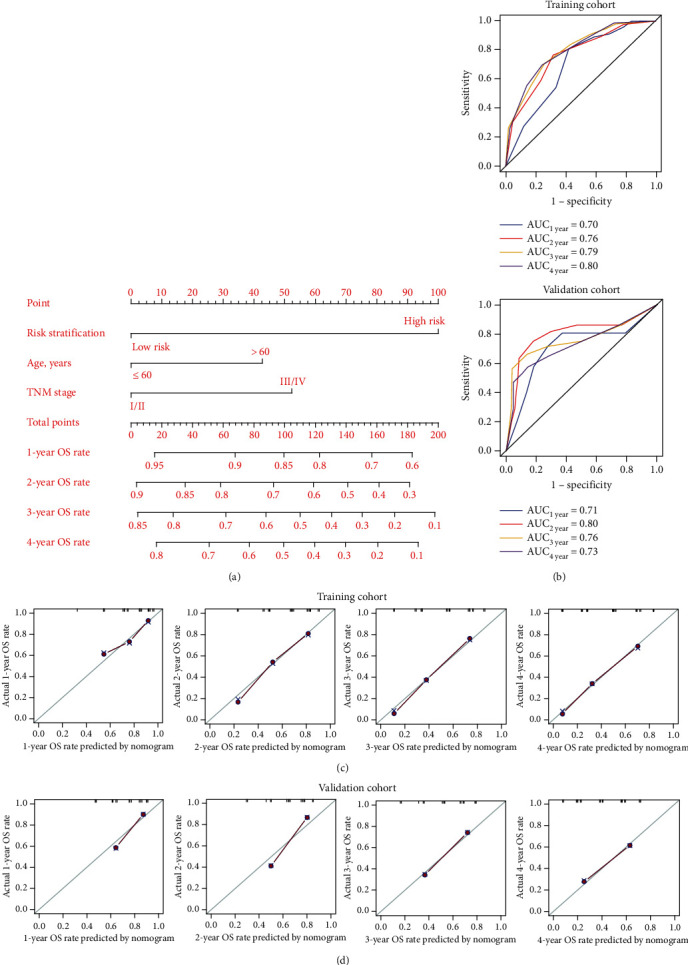
Figure 7.

Construction of the nomogram model. (a) The combination of risk stratification, age, and TNM stage visualized and personalized the OS rate of ESCC patients. After a point was assigned to risk stratification, age, and TNM stage of each patient according to the nomogram model, the total points were obtained to predict the OS rate of ESCC patients. (b) The time-dependent receive operating characteristic curve (ROC) curve was used to evaluate the performance of the nomogram model in the training (a, b) and validation (c, d) cohorts. (c d) The calibration curves were used to evaluate the performance of the nomogram model in predicting the OS rate in training (c) and validation (d) cohorts. The criterion for good performance of the nomogram model was that the predicted OS rate was relatively consistent with the actual OS rate. AUC: the area under the curve.
