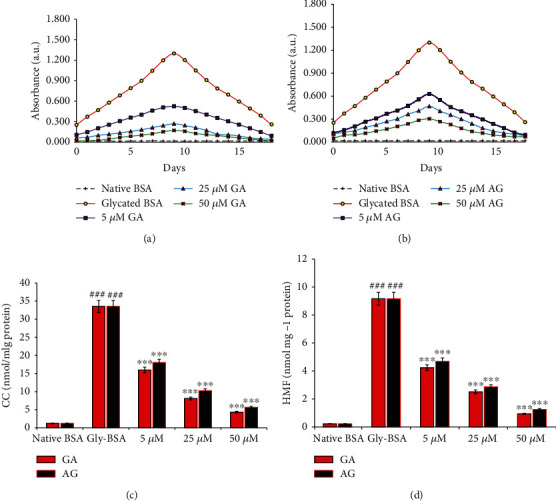
Figure 2.

(a, b) Effect of GA and AG on NBT reduction. The data is representative of the mean ± SEM of three independent assays. (c) Carbonyl content in native BSA, Gly-BSA, and GA-/AG-treated Gly-BSA. The data represented the mean ± SEM of three independent experiments. Significant difference vs. native BSA at ###p < 0.001. Significant difference vs. Gly-BSA at ∗∗∗p < 0.001. (d) HMF content of native BSA, Gly-BSA, and GA-/AG-treated Gly-BSA. The data represented the mean ± SEM of three independent experiments. Significant difference vs. native BSA at ###p < 0.001. Significant difference vs. Gly-BSA at ∗∗∗p < 0.001.
