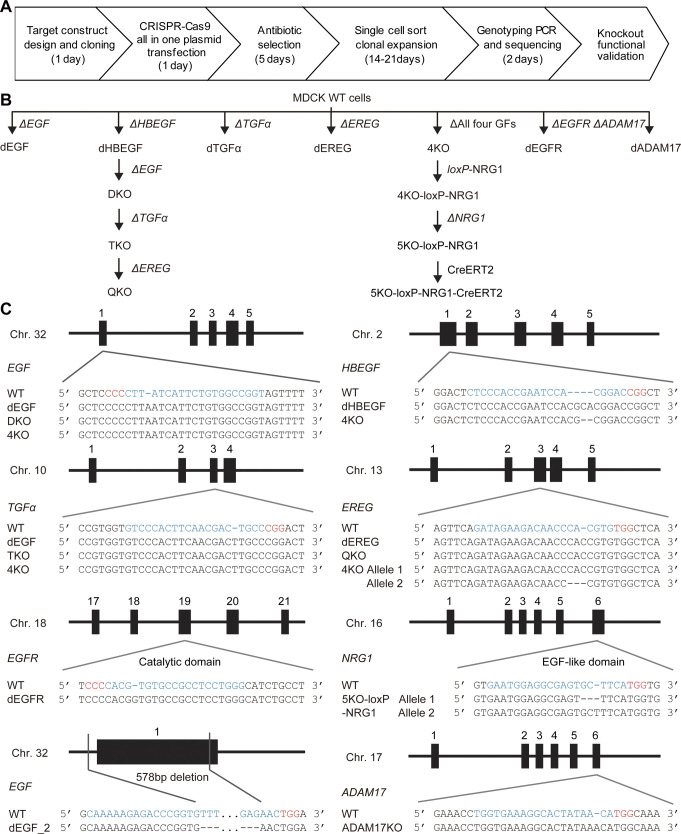
Figure S2. Generation of gene knockouts.
(A) Workflow for generation of gene knockouts in MDCK cell lines. (B) Phylogenetic tree of the MDCK cells used in this study. (C) Mutations of the targeted genes in the MDCK cell lines. Black rectangles depict exons. The gRNA and PAM sequences are depicted in blue and red, respectively.

