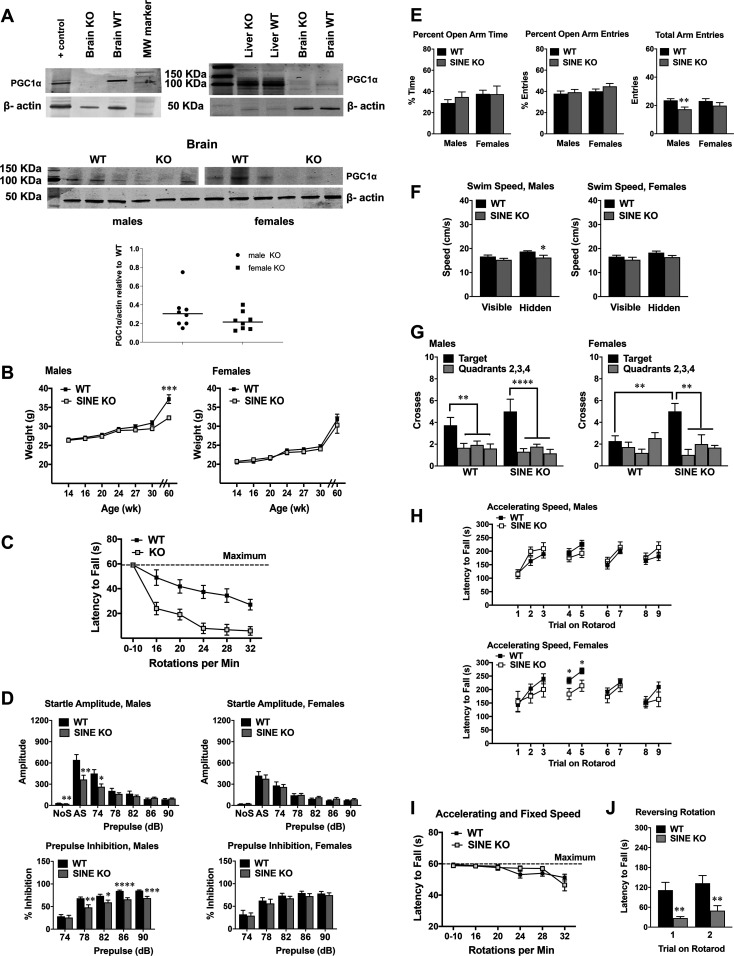
Figure 2. Mutations on the short interspersed nuclear element (SINE) lead to sexual dimorphic behavioural deficits in the absence of gross brain lesions.
(A) Western blots in brain lysates from WT or KO animals (left panel); lysates from HA-tagged PGC1α-overexpressing NIH3T3 were used as positive control. Right panel shows data from liver and brain lysates. Lower panel show additional samples from animals that have submitted to the behavioural tests; male and female samples were run in separate gels for PGC1α, whereas all 12 samples were run together for actin. Graph depicts the mean PGC1α relative to actin in KO animals relative to the WT counterparts (n = 8/sex/group). (B) Weight from WT and SINE KO over time; final weight measure was approximately at 60 wk in age. Male mice (genotype × age interaction, F[6,156] = 10.97, P < 0.0001); ***P = 0.0009. (C) Rotarod test in which mice underwent 2 trials each at rotating speeds of 0–10 accelerating and 16, 20, 24, 28, and 32 fixed RPM. Each trial was a maximum of 60 s, with at least 5 min between each trial (KO n = 18, 12 males and 6 females, WT n = 15, 8 males and 6 females). Data are means (+SEM) of 2 trials per rpm. Trials 0–10 had accelerating speed; remaining trials had fixed speeds. Genotype × speed interaction: F(1,19) = 5.218, P = 0.034; 16 RPM, P = 0.06; 20 RPM, P = 0.016; 24 RPM, P < 0.001, 28 RPM, P = 0.001, 32 RPM, P = 0.004). (D, E, F, G, H, I, J) Data shown are means (±SEM) from 19 SINE KO mice (13 males and 6 females) and 26 WT controls (15 males and 11 females). (D) Magnitude of startle responses and prepulse inhibition in Pgc1α SINE isoform-specific KO mice. Trials included no stimulus (NoS) and acoustic startle stimulus (AS, 120 dB) alone. Males, amplitude, genotype × decibel interaction (F[6,156] = 7.9, P < 0.0001); NoS, **P = 0.006; AS, **P = 0.0096; 74 dB, *P = 0.0133. Males, prepulse inhibition, main effect of genotype (F[1,26] = 11.25, P = 0.0025; genotype × decibel interaction, F[4,104] = 3.85, P = 0.0058); 78 dB, **P = 0.0028; 82 dB, *P = 0.0229; 86 dB, ****P < 0.0001; 90 dB, ***P = 0.0002. (E) Elevated plus maze; total arm entries, main effect of genotype (F[1,41] = 7.89, P = 0.0076); males, *P = 0.0036. (F) Morris water maze, swim speeds on the first days of visible and hidden platform tests. Males: main effect of genotype (F[1,26] = 7.88, P = 0.0094), Hidden, *P = 0.0159. (G) Quadrant preference in the water maze during a 1-min probe trial after hidden platform training. Measures were taken of swim path crosses over the platform location (Target; Quadrant 1), and the corresponding locations in Quadrants 2, 3, and 4. Males: effect of quadrant (F[3,78] = 14.77, P < 0.0001); WT, **P = 0.0093; SINE KO, ****P < 0.0001. Females: genotype × quadrant interaction (F[3,45] = 3.99, P = 0.0133); WT versus SINE KO, **P = 0.0059; SINE KO, **P = 0.0045. (H) Motor coordination on an accelerating rotarod test. Trials 4 and 5 were given 48 h after the first three trials, when mice were 16–19 wk in age. Mice were 31–36 wk in age for trials 6 and 7 and were retested at 50–61 wk. Trials 4 and 5, females, main effect of genotype (F[1,15] = 7.41, P = 0.0158); Trial 4, *P = 0.04; Trial 5, *P = 0.0196. (I) Animals were subjected to the same protocol as in (E). (J) At 56–66 wk, animals performed a rapid-reversal rotarod. Data from males and females are pooled. Main effect of genotype (F[1,43] = 9.49, P = 0.0036); Trial 1, **P = 0.0043; Trial 2, **P = 0.0089.

